
Understanding colour vision and how to screen for it
How colour blindness works, what the dot plates actually test, how the hue puzzle and the simulator help designers, and why a screen can never replace a proper examination.
How colour vision works in the eye
The retina holds three types of cone cell, each sensitive to a different part of the spectrum. One set responds most to long wavelengths, which we call red. Another peaks at medium wavelengths, roughly green. The third peaks at short wavelengths, blue. The brain compares the signals from all three and builds the colour you see.
Colour vision deficiency happens when one type of cone is missing or responds to a shifted range. The most common form confuses red and green. A rarer form confuses blue and yellow. Total colour blindness, where only shades of grey are seen, is very rare.
Who is affected
Roughly one man in twelve has some form of colour vision deficiency. For women the figure is about one in two hundred. The difference is genetic. The genes for the red and green cone pigments sit on the X chromosome, and men have only one copy. A woman needs the variant on both copies to be affected, which is why the condition is so much less common in women.
Most people with colour blindness live with it comfortably. Many do not discover it until they are tested, because the brain fills in what it can. The problems show up in specific tasks: sorting wires by colour, reading a chart that uses red and green for two data series, or passing a professional screening.
The hidden number plates
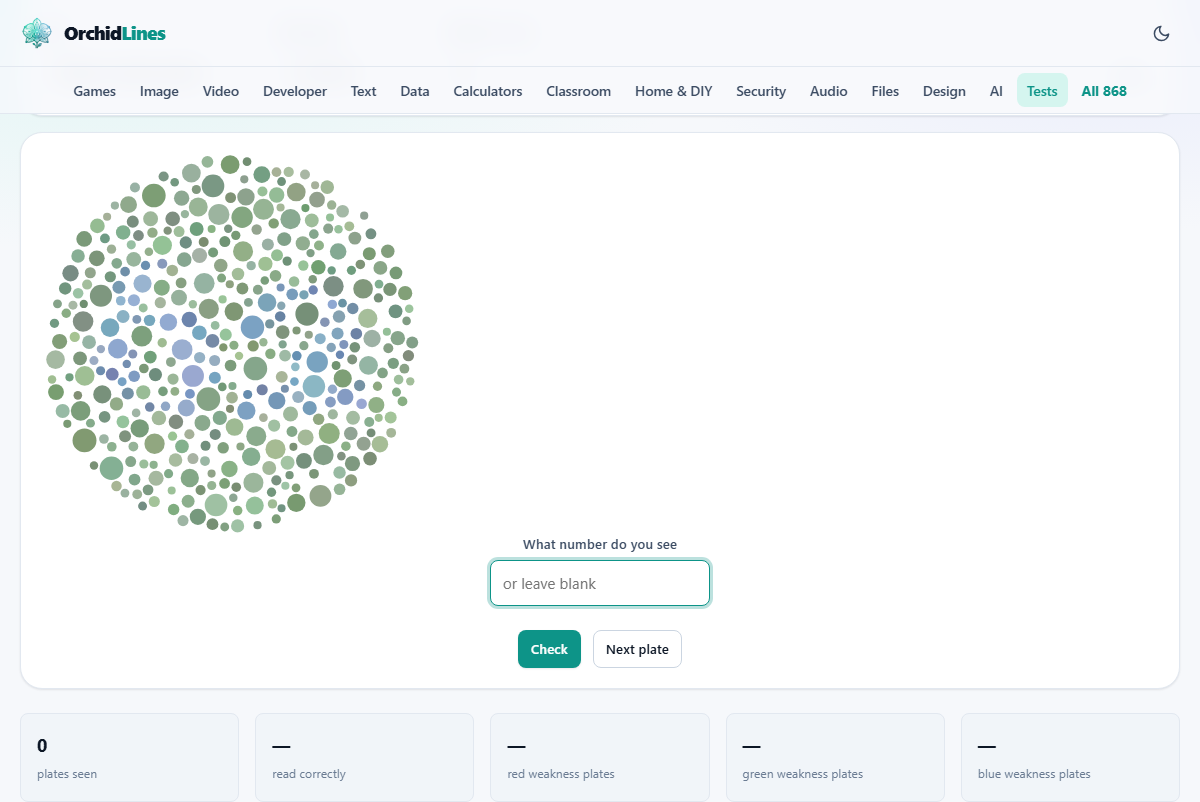
The test generates plates in the style made famous by Shinobu Ishihara in 1917. A circle of dots contains a number drawn in dots of a different colour. If your three cone types are working normally, the number stands out. If one type is weak or missing, the dots blend together and the number disappears.
The Test dropdown selects Hidden number plates. A plate appears on screen and you type the number you see into the answer field, or leave it blank if nothing stands out. Press Check to see the correct answer, then Next plate to move on.
One plate proves nothing. Set the Plates in a run field to eight or more and work through them all. A pattern across several plates is far more telling than any single one.
Choosing a plate type
The Plate type dropdown lets you focus the plates on a particular deficiency. A mixture is the default and is the best starting point. It draws plates that test for red weakness, green weakness and blue weakness in a shuffled order.
If you already know you have a red-green issue and want to see how strong it is, pick Red weakness or Green weakness. Blue weakness plates target the rarer tritan form. Each type uses a different pair of hues for the hidden number and the background dots.
The hue arrangement puzzle
Switch the Test dropdown to Arrange by hue and you get a row of coloured swatches in a random order. Your job is to drag them into a smooth sequence from one end of the hue range to the other. This is modelled on the clinical Farnsworth-Munsell test, where a patient sorts physical colour caps under controlled lighting.
Press Score it when you are done. The result shows how many swatches are out of place. A perfect score means every swatch landed in the right position. A few errors are normal, especially where neighbouring swatches are very close in hue. A cluster of errors in one part of the spectrum points at the same region the plates test.
Press Shuffle again to start fresh. The swatches are randomised each time, so repeating the test is fair. Try it a few times. If the same region of the spectrum keeps giving you trouble, that is a meaningful pattern rather than bad luck.
Seeing through someone else's eyes
Switch to See how others see colour and you get a simulator. It takes a set of colour patches and shows how they appear under three kinds of colour vision deficiency: protanopia (no red cones), deuteranopia (no green cones) and tritanopia (no blue cones).
This is the part designers should spend the most time with. Two colours that look distinct to you can collapse into a single tone for someone with a deficiency. The classic mistake is using red and green as the only difference between two states, the way a traffic light does. A traffic light gets away with it because the position of the lit lamp carries the same information. A chart that relies on colour alone does not.
- Add a shape, an icon or a text label whenever colour carries meaning.
- Check your palette before you ship. Two distinct hues may become one.
- If a dashboard uses red for danger and green for safe, add a second cue such as a cross and a tick.
Why a screen test cannot diagnose
Real Ishihara plates are printed to a controlled specification and examined under standard lighting. The entire test depends on precise colours landing on the retina. A monitor has its own colour profile, brightness level and surrounding glare, and none of those are controlled here.
These plates are generated rather than reproduced from the clinical originals. A clear result is worth mentioning to an optometrist. A poor result could mean a genuine deficiency or it could mean a badly calibrated monitor. A person with perfectly ordinary colour vision can fail on a screen that crushes its red channel.
Treat this as a screening tool, not a verdict. If several plates in a row show the same weakness, book an eye appointment and mention what happened.
What the statistics tell you
After you work through a run, numbers appear below the plates. They count how many you got right, how many you missed and which type of weakness the missed ones point toward. The breakdown splits results by deficiency type, so you can see whether errors cluster around red-green or blue-yellow.
A clean sweep does not guarantee perfect colour vision. It means your eyes can separate the hues the plates chose, on this screen, at this brightness, today. A miss on one or two plates could be noise. A miss on five or six in a row is a signal.
Keep the Clear button in mind. It wipes the running tally so you can start a fresh run without reloading the page. That is useful when you want to test a second person or try again under different lighting.
Getting the most from the test
- Use a well-lit room but avoid glare on the screen. The plates are not meant to be read in the dark.
- Do not squint or tilt your head. If the number is not obvious in a relaxed glance, it is not obvious, and that is the information the test needs.
- Try on more than one device if you can. A result that changes between your phone and your laptop tells you about the screens, not your eyes.
- Do not adjust your monitor's colour settings between plates. The point is to test your vision under consistent conditions.
- Run at least eight plates. Three is the minimum the tool allows, but the pattern only becomes clear over a longer run.
- If you normally wear colour-correcting glasses, try once with and once without.
The three types explained
Protanopia means the red cones are missing entirely. Protanomaly means they are present but shifted. Both make red and green hard to tell apart, and reds can look dark or muddy. Deuteranopia and deuteranomaly are the green-cone equivalents. They are the most common forms and produce similar confusion between red and green, though the exact shades that merge differ.
Tritanopia affects the blue cones. It confuses blue with green and yellow with violet. It is rare and is the only form that affects men and women at roughly equal rates because its gene sits on a different chromosome.
Nothing leaves your device
Every plate, every puzzle and every simulation is built inside your browser. No image is sent to a server and no result is stored anywhere beyond the page you are looking at. Close the tab and it is gone. The tool works entirely offline because there is no remote service behind it.