
Seeing what steady monthly investing could grow into
A systematic investment plan turns a small monthly habit into something much larger over time, but the numbers involved are hard to picture without running them. This article explains how the SIP calculator works, what each setting does, where the maths comes from, and why the answer should be treated as a sense of scale rather than a forecast.
What a SIP actually is
SIP stands for systematic investment plan. Instead of saving up a large amount and investing it all at once, you put a fixed sum into an investment every month. The idea is simple: automate the habit, remove the temptation to time the market, and let compounding do the heavy lifting over years.
The strength of a SIP is that it does not demand a starting pile of money. Someone investing a modest amount each month for twenty years can end up with a balance that surprises them, because each instalment earns returns on top of the returns it already earned. The calculator on this page makes that growth visible by doing the compound-interest arithmetic for you.
Filling in the basics
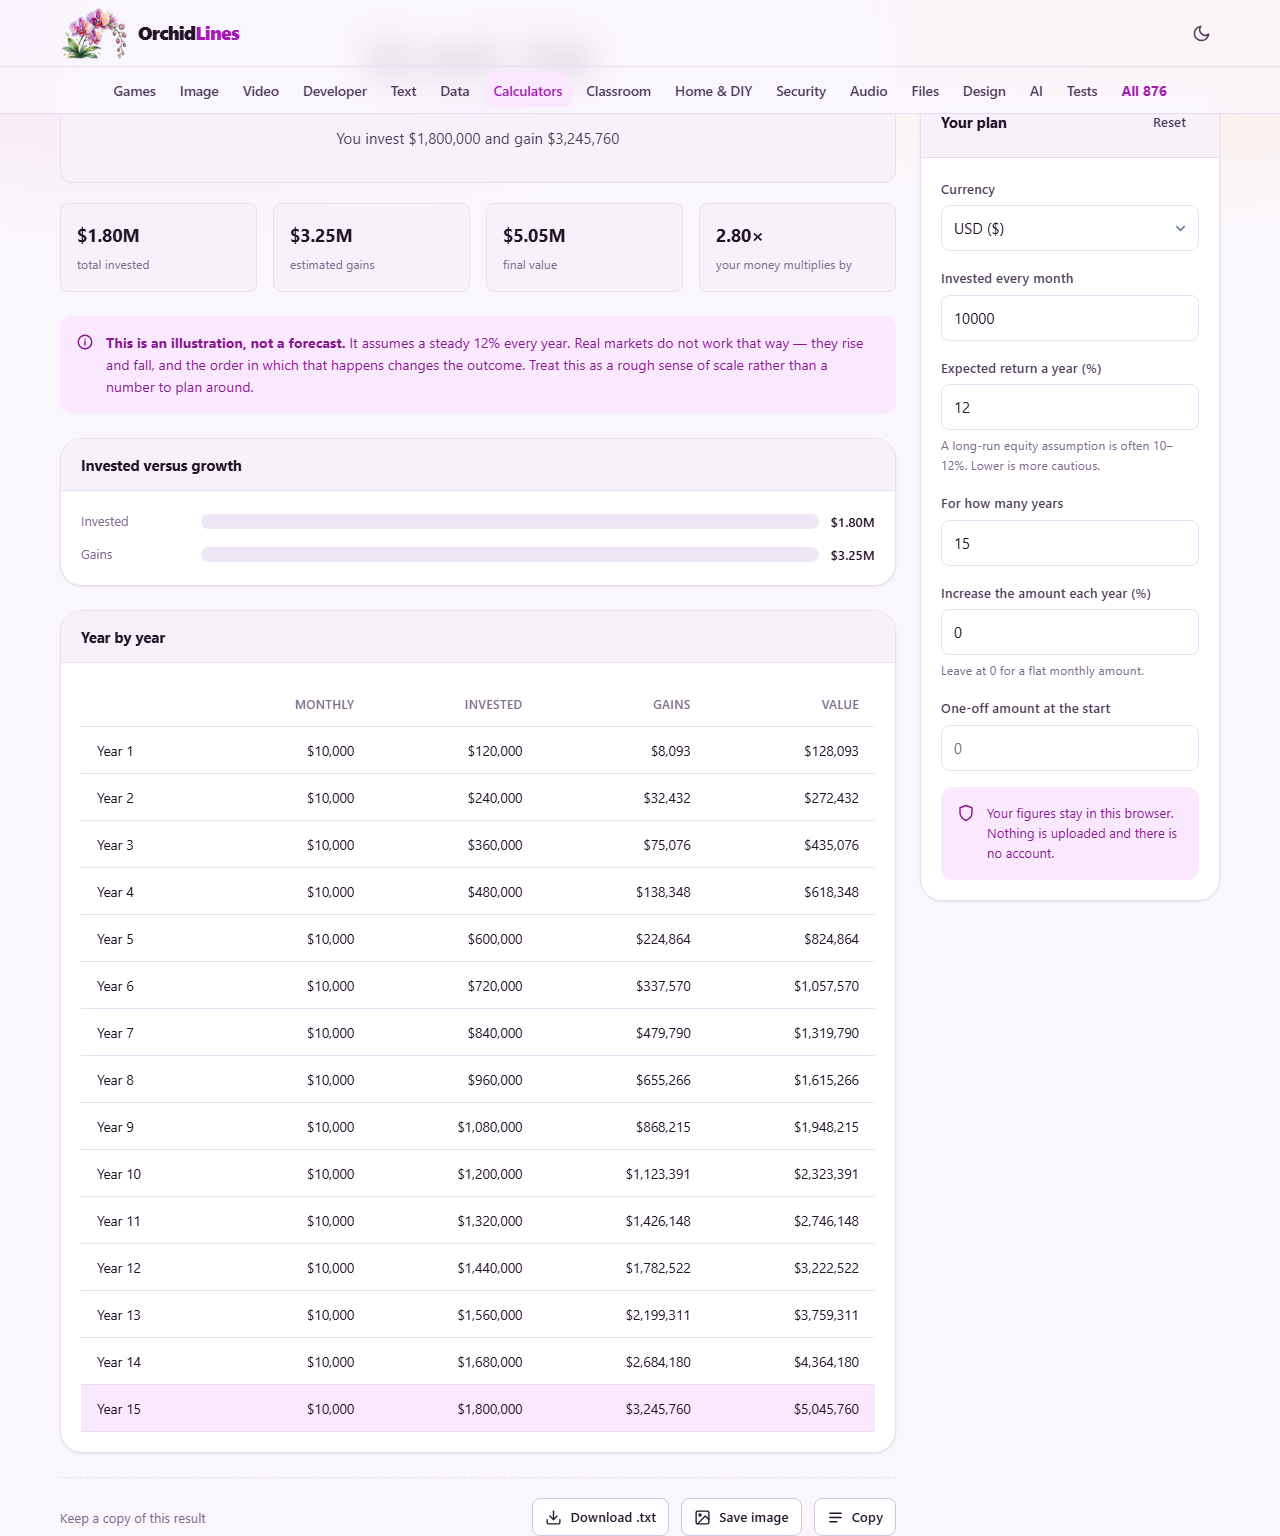
The panel on the right-hand side asks for four things to start. First, pick a currency from the dropdown. Then enter the amount you invest, or plan to invest, each month in the field labelled Invested every month. Next, put your expected annual return as a percentage in Expected return a year. Finally, set the number of years you intend to keep going in For how many years.
The result updates as you type. You see the total amount invested, the estimated gains, and the combined final value. A year-by-year breakdown shows how the balance builds, so you can see at which point the gains start to outweigh your contributions. That crossover moment is the practical meaning of compound growth, and it usually arrives sooner than people expect.
The step-up and why it matters so much
Below the core fields there is one labelled Increase the amount each year. This is the step-up: a percentage by which your monthly payment rises at the start of each new year. If you earn more over time, your investments can grow with your salary rather than staying frozen at the figure you started with.
The effect of a step-up over a long period is striking. Even a five percent annual increase compounds on top of the investment growth itself, so the later years contribute far more than the early ones. In many scenarios, raising your instalment by a modest percentage each year does more for the final number than chasing a slightly higher rate of return, and it is entirely within your control, unlike the market.
Adding a lump sum at the start
The field labelled One-off amount at the start lets you model a scenario where you also have a sum to invest on day one. Perhaps you received a bonus, sold something, or have savings sitting idle. That lump sum compounds for the entire period, so it gets the full benefit of every year of growth.
You can also use this field to compare strategies. Enter only a lump sum with no monthly amount and see what it grows to. Then enter only a monthly amount with no lump sum and compare. The lump sum wins on paper because all the money is working from the start, but it also requires having it all upfront, which is the whole reason SIPs exist.
How the maths works under the surface
Each monthly instalment is treated as if it is invested at the start of the month. That means the very first payment compounds for the full period, the second payment compounds for one month less, and so on down to the last payment, which earns just one month of growth. This is the beginning-of-period convention, and it gives a slightly higher result than the end-of-period version some other calculators use.
The annual return is converted to a monthly rate by dividing by twelve and adding one. Every instalment is then multiplied by that rate raised to the number of months it has left to grow. Add them all up and you have the future value. When a step-up is involved, the monthly amount itself changes at the start of each year, but the compounding logic stays the same.
Why this is an illustration, not a promise
The calculator assumes exactly the same return every single month for the whole period. Real investments do not behave that way. Markets climb, fall and go sideways for years at a stretch, and the order in which those returns arrive changes the outcome even when the long-run average is the same.
A run of poor years early on, when the balance is small, does less damage than the same poor years at the end, when the balance is large. This is called sequence-of-returns risk, and no fixed-rate projection can model it. The number on the screen should be read as a rough order of magnitude: it tells you whether you are in the right ballpark, not what you will actually have at the end.
Returns shown here are also before fund charges and taxes. Both of those eat into the real outcome. For a more honest estimate, subtract the expense ratio of your fund from the annual return before entering it. The result will be lower, but it will be closer to what you keep.
Testing your plan at different rates
One of the most useful things you can do with this page is run the same plan at several different return assumptions. Try your optimistic case, a middle case, and a low case. If the plan still makes sense at seven percent instead of twelve, it is a robust plan. If it only works at the high end, you are depending on an outcome nobody can guarantee.
The same logic applies to the step-up. Try it with no annual increase, then with five percent, then with ten. Seeing the three side by side gives you a feel for how much of the final result comes from the market and how much comes from your own increasing contribution. The part that comes from you is the part you can control.
The year-by-year breakdown
Below the headline numbers, the result area shows a table broken down by year. Each row lists the monthly instalment for that year, the total you have put in so far, the gains earned so far, and the combined value at the end of that year. The column that surprises most people is the gain column: in the early years it barely moves, but in the later years it can exceed the amount you invested in the entire previous decade.
This is compound growth made visible. It is not a straight line; it is a curve that bends upward more steeply the longer it runs. Seeing the table often does more to motivate a long time horizon than any abstract explanation of compounding can.
What this page does not do
This is a calculator, not an adviser. It cannot know your tax bracket, your risk tolerance, your debts, your time horizon beyond what you type in, or whether you should be investing at all right now. It performs arithmetic on numbers you supply and shows you the result. If the decision matters, and investment decisions usually do, speak to someone qualified to give personal advice.
It also does not model inflation. A large number twenty years from now will buy less than the same number today. Some people subtract an inflation estimate from the return rate to get a rough real-terms figure, and you can do that here by entering a lower percentage. It is not precise, but it keeps the result grounded.
Your figures stay on your device
Every calculation runs inside your own browser. Nothing you enter is sent to a server, stored in a database or shared with anyone. There is no account to create and no data to hand over. You can verify this by turning off your internet connection and watching the page continue to work exactly as before.
For a financial tool, that privacy matters. The amounts people enter here are real savings, real salaries and real ambitions. Keeping all of that inside the browser means nobody else ever sees it, and there is nothing to delete because nothing was collected in the first place.