
How to compare renting and buying a home without fooling yourself
The rent versus buy question is one of the biggest financial decisions most people face, and most arguments about it are badly flawed. This article walks through the calculator's model, explains what each input controls, and shows why the crossover year matters more than which side is cheaper today.
Why most comparisons get it wrong
The usual argument goes like this: your mortgage payment is a certain amount, your rent is a certain amount, and whichever is smaller wins. That comparison misses almost everything that matters.
A buyer puts down a deposit that stops earning the moment it becomes a house. The buyer pays stamp duty, legal fees and surveys on the way in, and agent fees on the way out. The buyer pays for maintenance, insurance and property tax every year, whether or not the boiler breaks. None of that appears in the mortgage payment.
A renter, on the other hand, still has the deposit. If that money goes into an investment and earns a return, the renter builds wealth too, just in a different form. Leaving this out is the single biggest flaw in the phrase rent is dead money. The calculator models both paths month by month, so neither side gets an unfair head start.
The inputs and what they control
The panel labelled Your situation holds every assumption the model uses. Property price and Deposit set the starting point. The mortgage is the difference between the two, repaid over the Mortgage term at the Mortgage rate you enter.
Rent for a similar home is the monthly rent for a place you would actually live in, not the cheapest listing you can find. The comparison only means something if both sides describe the same quality of life. Rent rises by sets how fast that rent grows each year.
Property grows by is the annual rate at which the house gains value. Investments return is the annual rate the renter earns. The pot starts with all the cash a buyer would hand over on day one, which is the deposit plus the buying costs, and every monthly surplus is added on top of that. These two guesses drive the result more than any other input. Change either one by two percentage points and watch the answer swing.
Upkeep and repairs is a percentage of the purchase price per year, typically around one per cent. It is held against the price you paid rather than the growing value, so a long comparison understates upkeep a little in the later years. Property tax and insurance is a flat annual amount. Buying costs and Selling costs are percentages for stamp duty, legal fees and agent commissions. Compare over sets how many years the model runs.
How the model runs month by month
Each month, the buyer makes a mortgage payment, part of which is interest and part principal. The buyer also pays a share of the annual maintenance and tax. The property grows in value at the rate you chose.
Each month, the renter pays rent. If the buyer's total outgoing that month is higher than the rent, the difference is added to the renter's investment pot. The pot compounds at the investment return rate you set. In the months where the rent is the higher of the two, nothing is added and nothing is taken back out. The pot just carries on compounding, and the extra rent is caught at the end instead, when all the rent paid is subtracted from the pot to give the renter's net position.
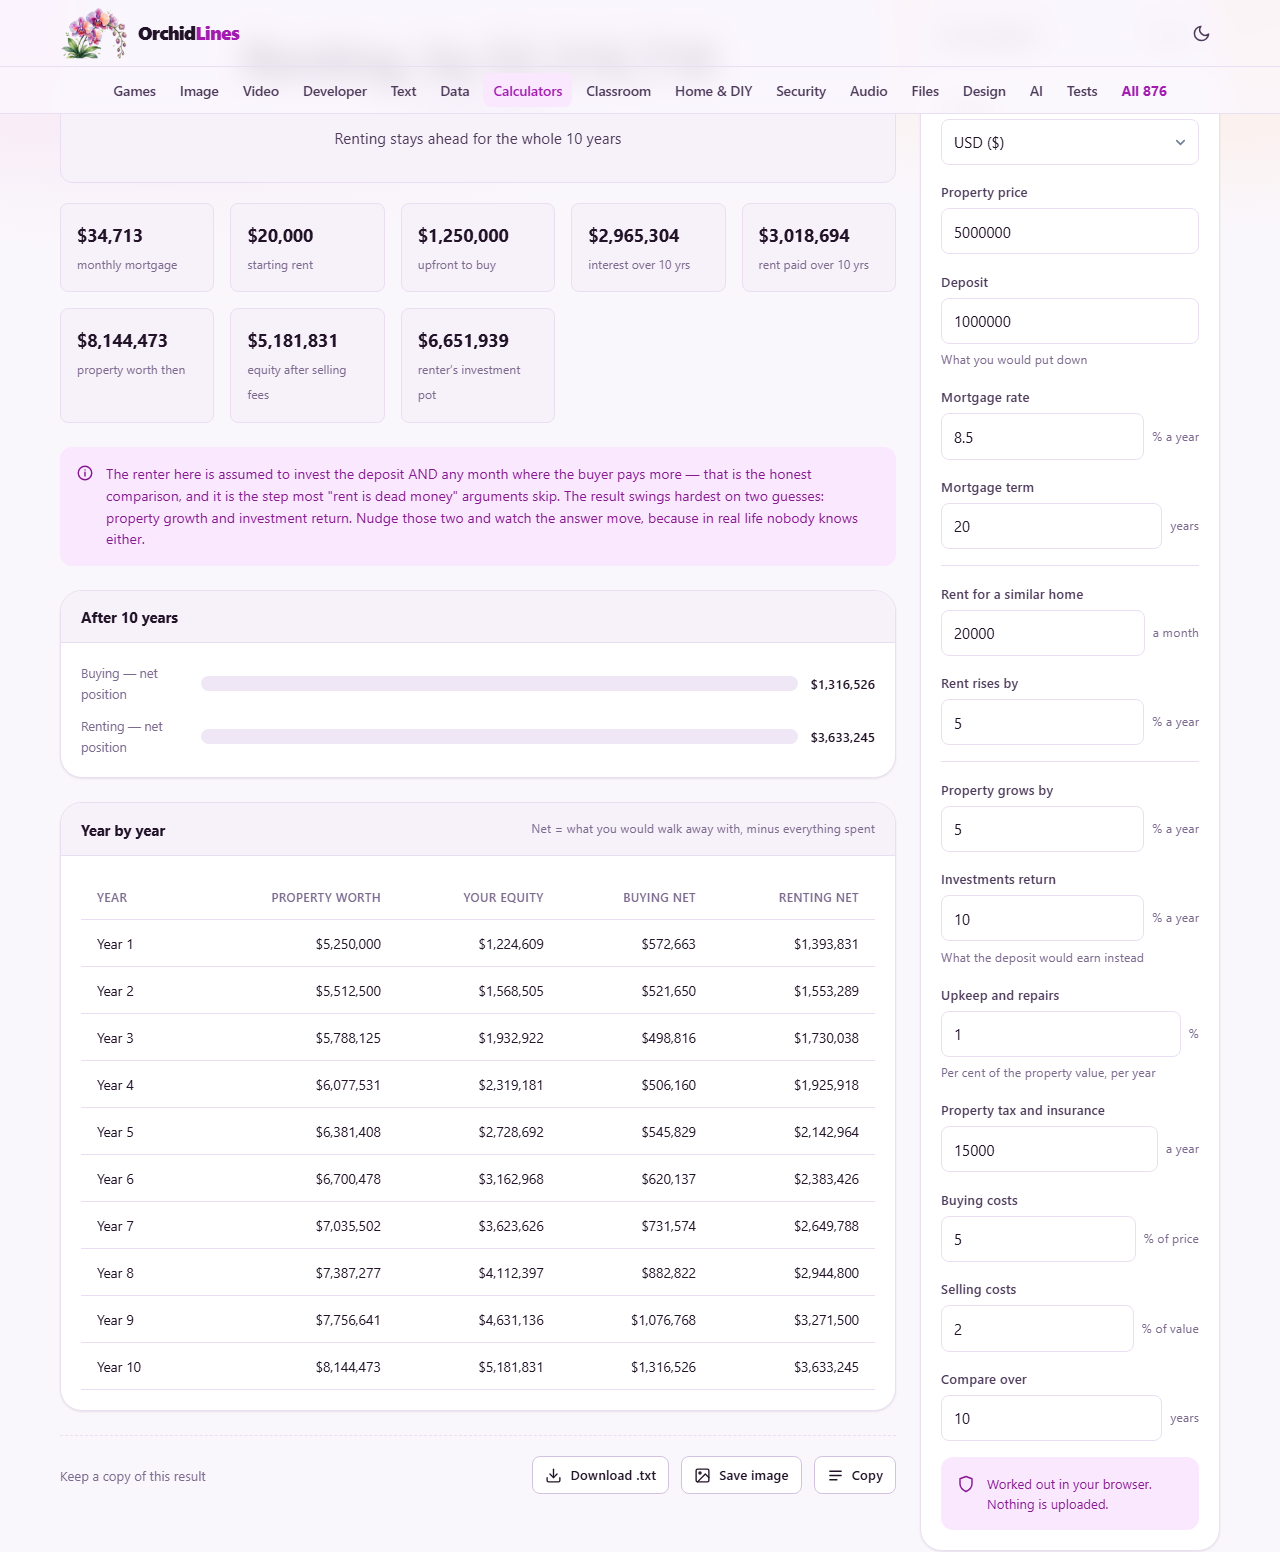
At the end of each year, the model works out the buyer's net position: the property value minus selling costs, minus the remaining mortgage, minus everything spent on interest, fees and upkeep. It also works out the renter's net position: the investment pot minus all rent paid. The year these two cross is the crossover year.
The crossover year and what it tells you
Buying is front-loaded with costs. The deposit, the stamp duty and the early years of a mortgage, where most of the payment goes to interest, all hit in the first few years. Renting starts far ahead because the renter still has all that money invested.
Over time, the buyer builds equity, the property grows, and the mortgage shrinks. At some point, buying pulls ahead. That point is the crossover year. If you plan to move before it arrives, the numbers favour renting. If you plan to stay well past it, buying wins.
The calculator shows this crossover in the summary and in the year-by-year table. It also draws a comparison bar showing the net position of each side at the end of your chosen period. A quick glance tells you which path comes out ahead and by how much.
The assumptions that swing the answer hardest
Property growth and investment return are the two numbers you should worry about most. A buyer who expects six per cent property growth and a renter who earns four per cent on investments will get a very different answer from the reverse.
Try three runs: an optimistic one where property does well, a pessimistic one where it is flat, and one where both growth rates are equal. If buying wins in all three, the decision is robust. If it only wins when property growth is high, you are betting on a guess.
Rent growth matters over long periods. Five per cent annual rent growth sounds modest, but over twenty years it more than doubles the monthly rent. A renter who enters a low figure here is giving themselves an advantage that may not hold.
What the renter has to actually do
The model assumes the renter invests the deposit and any monthly saving at the stated return. In real life, that is the hard part. A buyer builds equity automatically through mortgage payments, which is a form of forced saving. A renter has to open an account, move the money, and leave it alone for decades.
A renter who spends the surplus instead of investing it does far worse than the figures here. That is the most common way the comparison breaks down in practice. The calculator is honest about this, but it is up to you to be honest with yourself about whether the investing actually happens.
On the other side, a buyer who borrows more than they can comfortably afford, or who neglects maintenance until it becomes expensive, will do worse than the model predicts. Both paths require discipline. The question is which kind of discipline suits you better.
Things the spreadsheet cannot capture
Security of tenure is worth something. A homeowner cannot be asked to leave when the landlord wants to sell. Freedom to change the kitchen, paint the walls, or keep a dog is worth something too. On the other side, a renter can move city for a job in a fortnight. A homeowner is pinned to one place until the house sells.
Maintenance stress is another invisible cost. A burst pipe at midnight is the homeowner's problem. A broken boiler in January is theirs to fix and pay for. A renter calls the landlord. The financial model captures an average maintenance percentage, but it cannot capture the worry, the time lost, or the weekend spent waiting for a plumber.
These are not financial questions, and no calculator can answer them. But they are real, and for many people they matter more than the crossover year. Let the numbers inform the decision without making it.
Tax, pensions and what the model leaves out
The calculator does not include tax relief on mortgage interest, because the rules vary by country and change often. If you receive meaningful relief, you can reduce the mortgage rate slightly to approximate the effect. It also does not include capital gains tax on the investment pot or on the property.
State pensions, rental income from a second property, or inheritance are all outside the model. The tool is built to answer one question cleanly: given these assumptions, which path leaves you with more money after this many years? Anything else is a conversation with a qualified adviser who knows your full position.
Privacy and saving your figures
Your income, your deposit, your rent and every other number you type stay inside your own browser. Nothing is sent to any server. There is no account, no login, and no record at the other end. The entire simulation runs locally, and the page works exactly the same way offline as online.
The page remembers your inputs so they are still there when you come back, stored in this browser on this device only. Clearing your browsing data removes them. For a decision this important, note down the figures you used and the result you got, along with the date. Assumptions age, and a comparison you ran two years ago may already be out of date. Run it again whenever rents move, interest rates change, or your plans shift. The numbers should follow your life, not the other way around.