
How to calculate the real value of money after years of inflation
A fixed amount of money buys less every year, and the loss is so gradual that it is easy to ignore until you look back over a decade and realise how far prices have moved. This article explains how the inflation calculator works, what the three directions mean, how to compare a pay rise against rising prices, and why the tool asks you for the rate rather than looking it up. Everything runs on your own device with nothing sent to a server.
What inflation does to a fixed sum
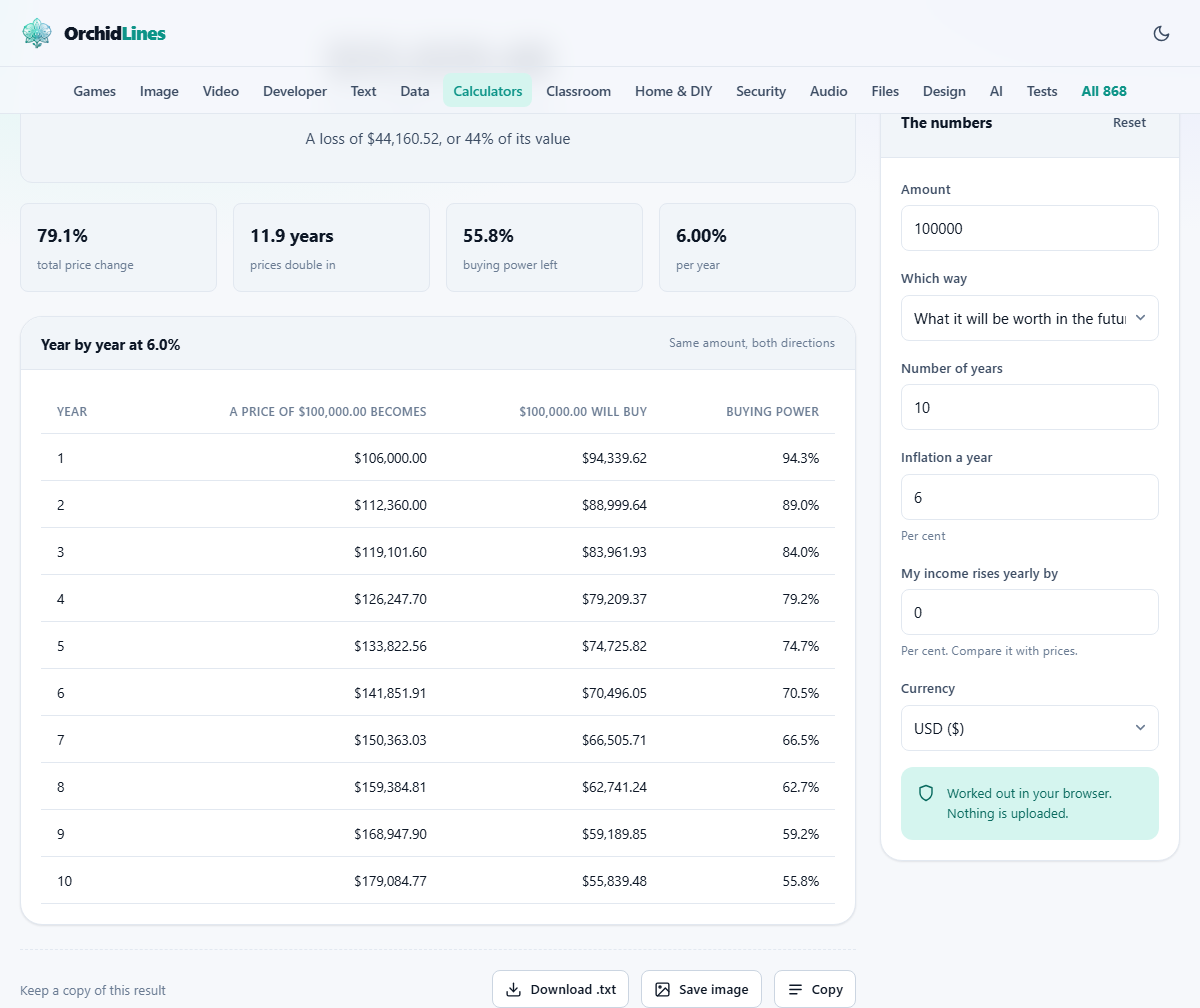
Inflation is the rate at which prices rise over time. If inflation runs at six per cent a year, something that costs 100 today will cost 106 next year, about 112 the year after, and roughly 179 in ten years. The price does not jump. It drifts upward in a way that feels manageable from month to month and startling when you compare the first year to the last.
The real damage is to money that sits still. A savings account paying two per cent while prices rise at six per cent is losing four per cent of its buying power every year. A pension that pays a fixed sum for life buys noticeably less after five years and roughly half as much after twelve, all without the number on the cheque changing at all.
The calculator takes any amount, a number of years and a rate, and shows what happens. The answer is a single number, but the year-by-year table underneath it makes the slide visible in a way the single number alone cannot.
The three directions you can calculate
A dropdown labelled Which way offers three choices. The first, What it will be worth in the future, takes an amount of money and shows what it will buy after the given number of years. This is the question a retiree asks about a fixed pension or a saver asks about a sum sitting in a low-interest account.
The second, What a past amount is worth today, works backwards. If your parents bought a house for 50,000 thirty years ago, this tells you what that amount means in current purchasing power. It is the same maths in reverse, and it is the one people reach for when comparing prices across decades.
The third, What I would need to match it, tells you how much money you would need at the end of the period to have the same buying power as the original amount. This is the one to use when planning a savings target or negotiating a contract that runs for several years.
Entering the numbers
The Amount field takes any figure. It can be a salary, the price of a house, a monthly pension payment, or the cost of a basket of groceries. The maths works the same regardless of scale.
Number of years can be anything from one to as many as you need. Ten is the default, and it is enough to show a clear pattern. Try twenty or thirty for retirement planning and you will see why financial advisers talk about inflation so often.
Inflation a year is where you enter the annual rate as a percentage. The default is six per cent, which is a reasonable middle ground for many countries over recent history. The field accepts decimals, so you can enter 3.5 or 7.2 if you want a more specific figure.
A Currency dropdown at the bottom lets you pick the symbol for display. This does not affect the maths. It only changes the label on the output so the numbers read naturally in your local currency.
Why the tool does not look up official rates
Many inflation calculators pull historical data from a government statistics office and do the work for you. This one does not, and the reason is structural. The entire site runs in the browser with no server behind it. There is nothing to store updated inflation tables for every country, no way to check whether the data is still current, and no mechanism to correct it when the statistics office revises a number.
Asking you for the rate is honest about that limit. It also turns out to be more useful than it sounds. Official inflation figures are based on a basket of goods that may not match what you actually spend money on. Rent, school fees, medical costs and fresh food have risen faster than the headline figure in most countries for the past two decades. Entering a rate a couple of points above the official one gives a result closer to what many households actually experience.
Try the calculation at two or three different rates. The gap between them shows how sensitive the outcome is, and that sensitivity is itself useful information.
Comparing a pay rise with rising prices
A field labelled My income rises yearly by lets you enter the rate at which your pay goes up each year. If that rate is below the inflation rate, you are falling behind even though your salary is growing. The calculator works out the gap and shows what your income is worth in real terms at the end of the period.
A five per cent pay rise sounds like good news until you learn that prices rose by seven per cent in the same year. In real terms you are about two per cent worse off. Over five or ten years, that gap compounds just like inflation itself, and the slide in buying power can be steep.
This is the most practical part of the tool for anyone in steady employment. Enter your current salary as the amount, set the inflation rate to something realistic, put your typical annual raise in the income field, and look at the table. Each row shows the nominal salary and what it buys relative to today. The moment the real column starts falling, you are losing ground.
The rule of seventy and doubling time
There is a quick mental shortcut for inflation. Divide seventy by the annual rate and you get roughly the number of years for prices to double. At five per cent, prices double in about fourteen years. At seven per cent, it takes ten. At ten per cent, seven years.
The calculator shows this figure alongside its other results, so you do not need to do the division yourself. The doubling time is the single most vivid way to grasp what a given rate means in practice. Saying that inflation is six per cent lands differently from saying that everything will cost twice as much in twelve years.
The rule works because inflation compounds. Each year's increase applies to the already-increased price from the year before, not to the original. That is why the damage accelerates rather than growing in a straight line, and why even a modest rate becomes serious over a long enough stretch.
Fixed incomes and long-term contracts
Pensions that pay a fixed amount for life are the clearest case of inflation risk. A pension that felt comfortable at retirement can leave someone struggling ten years later without the payment itself changing at all. The calculator makes this visible by showing the buying power of the same sum year after year.
Long-term contracts have the same problem. A five-year service agreement priced today will be cheaper in real terms by the end if it does not include an escalation clause. Landlords, freelancers and suppliers all face this. Running the numbers before signing shows the cost of a fixed price and makes the case for building in an annual adjustment.
Savings targets are the mirror image. If you need a certain sum in ten years, the amount you need to save is higher than the number you have in mind today, because the target itself is moving upward with prices. The third direction in the calculator, What I would need to match it, gives you that adjusted target directly.
Making sense of the year-by-year table
The table underneath the headline result breaks the calculation into annual steps. Each row shows what your amount is worth at the end of that year and, if you entered an income rise, what your income looks like at the same point. Reading down the columns makes the trend impossible to ignore.
The early years look gentle. A six per cent drop in buying power in year one feels like rounding error. By year five the loss is noticeable. By year ten it is hard to dismiss. This is the shape of compound erosion, and the table is the best tool for communicating it to anyone who thinks inflation is someone else's problem.