
How to use four standard formulas and BMI to find a healthy weight range for your height
There is no single number that counts as the right weight for a given height. Four formulas are in common use, they all give different answers, and none of them were designed for this job in the first place. This article explains what each formula does, why they disagree, how to read the results sensibly, and what other measures might serve you better. Everything runs on your own device with no data sent anywhere.
Why four formulas instead of one
The calculator shows results from Devine, Robinson, Miller and Hamwi. All four were created in the 1960s and 1970s, and none of them were built to tell people what they should weigh. They were clinical tools for working out drug dosages, where an estimate of lean body mass helps set the right dose. Over time they leaked into fitness and popular health, and today millions of people treat them as weight targets.
Each formula was derived from a different population using different methods. The sample sizes were small by modern standards, and the populations were not representative of the world. The result is that for the same height and sex, the four numbers can differ by several kilograms. That spread is not a flaw in the calculator. It is an honest reflection of how imprecise the whole idea is.
Entering your details
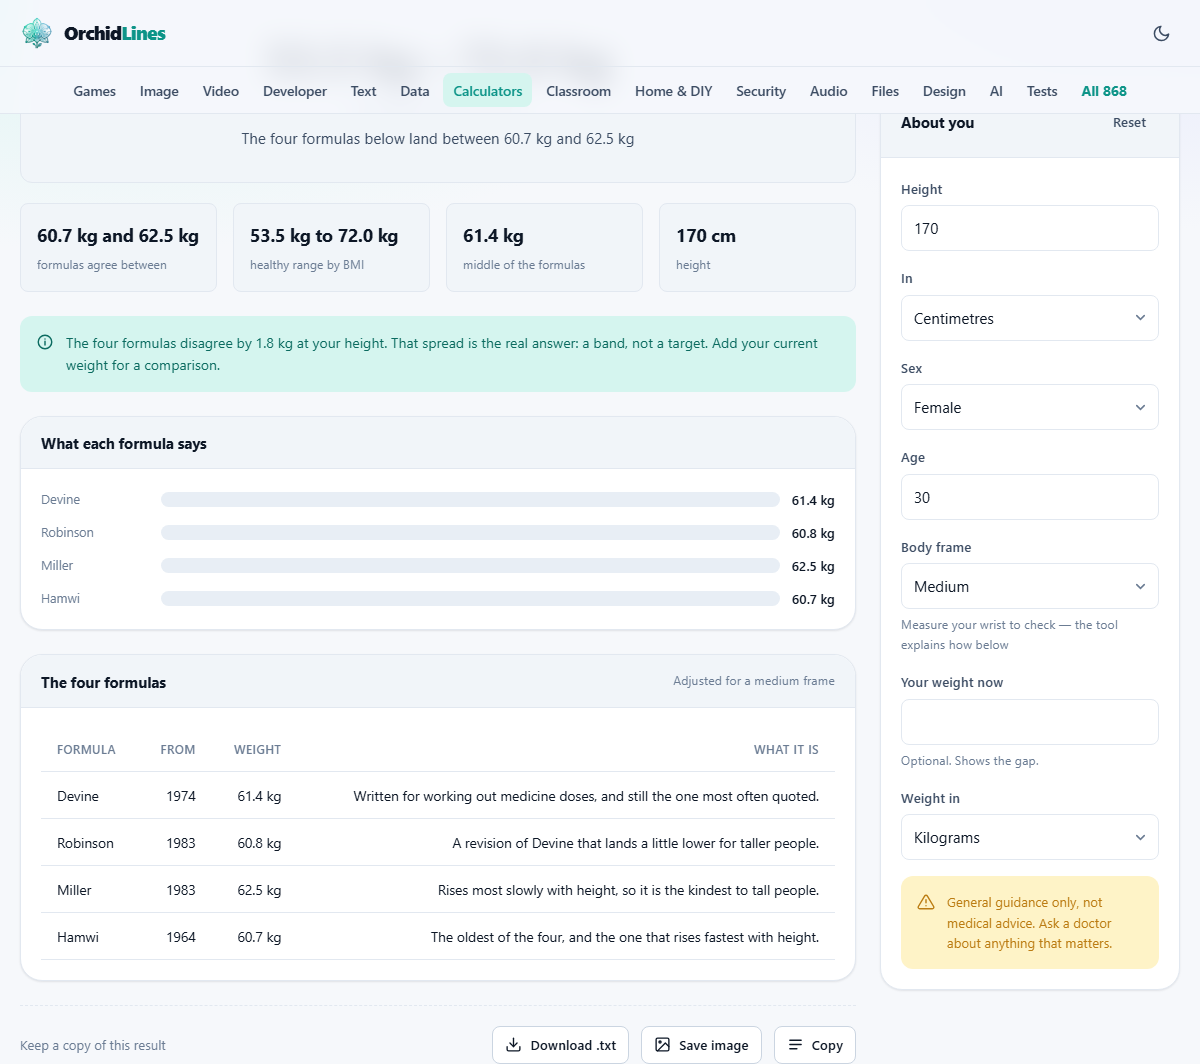
The panel is headed About you. Height goes in first, and a dropdown labelled In lets you choose between Centimetres and Feet and inches. If you pick feet and inches, a second field labelled And inches appears for the remaining inches. The Sex dropdown affects which version of each formula is used, because all four have separate equations for male and female bodies.
Age does not change the formula results directly, but it is shown alongside them for context. Body frame is a dropdown with three choices: Small, Medium and Large. The hint underneath suggests the wrist test: wrap your thumb and middle finger around the opposite wrist. If they overlap, your frame is small. If they just touch, it is medium. If they do not meet, it is large. Frame size shifts the result by roughly ten per cent in either direction from the medium figure.
Two more fields sit at the bottom. Your weight now is optional. Fill it in and the calculator shows how far your current weight sits from the middle of the range. Weight in lets you switch between Kilograms and Pounds.
Reading the results side by side
The results panel lists each formula by name with its figure for your height, sex and frame. Below them sits the healthy range from the body mass index, which is a band rather than a single number. The BMI range covers the values between 18.5 and 24.9 converted into weight for your height.
Look at the spread. For a medium-framed woman of 170 centimetres, the four formulas might sit between about 59 and 66 kilograms. The BMI healthy range might run from 53 to 72. The overlap is large, but the outer edges are far apart. That gap is the most useful thing on the page, because it reminds you that precision here is an illusion.
If you entered your current weight, the calculator shows the difference from the midpoint of the combined range and reports your current BMI. A BMI between 18.5 and 24.9 is labelled healthy. Outside that band, the label changes, but the label is a statistical category, not a diagnosis.
What body mass index actually measures
BMI divides your weight in kilograms by the square of your height in metres. It was invented in the 1830s by a Belgian statistician who wanted a simple ratio for comparing populations. It was never meant to assess individual health, and it cannot tell the difference between a kilogram of muscle and a kilogram of fat.
A competitive sprinter and a sedentary office worker can share the same BMI while having completely different body compositions. The sprinter carries dense muscle; the office worker may carry visceral fat around the organs. The health implications are not remotely similar, yet the single number treats them alike.
BMI is useful across large groups, which is why public health agencies still use it for population surveys. For one person standing on a bathroom scale, it is a rough filter at best. A high BMI with a small waist and good blood markers is a very different picture from a high BMI with a large waist and poor markers.
Frame size and the wrist test
Bone structure varies more than most people realise. Someone with wide shoulders, thick wrists and broad hips has a heavier skeleton than someone of the same height with a narrow build. The formulas do not account for this on their own, so frame size is applied as an adjustment after the fact.
The wrist test is the simplest way to estimate frame size without special equipment. Wrap the thumb and middle finger of one hand around the wrist of the other hand, just above the wrist bone. If the fingers overlap, you have a small frame. If they just touch, medium. If they leave a gap, large. It is not precise, but it sorts most people into the right third.
A small frame shifts the formula results downward and a large frame shifts them upward. The adjustment is roughly ten per cent, so for a medium figure of 65 kilograms, a small frame might show 59 and a large frame might show 72. The shift acknowledges that two people of the same height can have genuinely different healthy weights because of their build.
Where these formulas fall short
None of the four formulas account for muscle mass. A person who strength-trains seriously will weigh more than the formulas predict, and that extra weight is lean tissue, not excess fat. Athletes in sports like rowing, rugby, gymnastics and sprinting routinely fall outside the so-called ideal range while being in excellent health.
Age is another gap. Body composition changes with age in ways that height alone cannot capture. Bone density drops, muscle tends to decrease unless actively maintained, and fat tends to increase. A 25-year-old and a 65-year-old at the same height and weight are carrying that weight in different places and in different proportions.
The formulas also come from narrow populations, mostly from North American clinical settings in the mid-twentieth century. Applying them across all ethnic backgrounds and body types stretches them well beyond their original data. They remain in wide use because no simple replacement has taken hold, not because they are accurate.
Better measures to consider
The waist-to-height ratio has gained ground as a more practical indicator of health risk. Measure your waist at the navel, divide by your height, and aim for a result under 0.5. This catches the central fat that is most strongly linked to metabolic problems, and it needs nothing more than a tape measure.
Waist circumference on its own is also informative. For men, a waist over 94 centimetres raises risk; over 102 raises it further. For women, the thresholds are 80 and 88 centimetres. These numbers come from large epidemiological studies and have a stronger link to cardiovascular outcomes than BMI alone.
Body fat percentage, measured by skinfold calipers, bioimpedance scales or DEXA scans, gets closer to what really matters. But each method has its own error bars, and casual gym measurements should not be treated as laboratory-grade readings.
Using the results wisely
Treat the spread of numbers as a rough corridor, not a target. If you sit inside the range and feel well, there is no evidence that chasing the exact middle brings any benefit. If you sit far outside it, a conversation with a doctor is more useful than adjusting your diet based on a formula from the 1970s.
The warning on the page says it plainly: this is general guidance, not medical advice. None of these formulas apply to children or during pregnancy, where growth charts and clinical supervision are the right tools. For everyone else, the numbers are a starting point, and the honest takeaway is the size of the gap between them.
One last thing worth keeping in mind: how you feel, how you sleep, and how well you move through daily life are better signals than any number a formula can produce. Weight is one data point among many, and it is not even the most important one.