
Understanding compound annual growth rate and what it hides
This article explains how the CAGR calculator works, what each field does, how to read the results, and why the single smooth number it produces can be both useful and misleading when you are comparing investments or checking a fund's claims.
What CAGR is and why it matters
Compound annual growth rate is the single steady percentage that would have turned your starting value into your ending value over a given number of years. It flattens out every bump and dip in between and gives you one clean line. The formula takes the ending value, divides it by the starting value, raises that to the power of one divided by the number of years, and subtracts one.
The reason it exists is that simple averages lie. If an investment goes up 50 percent one year and down 50 percent the next, the average annual return is zero. But your money is actually down 25 percent. CAGR captures that loss because it works from the real start and end values, not from a stack of yearly figures.
Portfolio reviews, fund fact sheets, business plans, and revenue reports all lean on CAGR. It is the standard way to compare things that grew at different speeds over different periods. A savings account, a stock fund, and a real estate holding can all be reduced to one number apiece and set side by side. Startup founders use it to show revenue growth to investors. Property owners use it to measure how a house appreciated over a decade.
The controls on the input panel
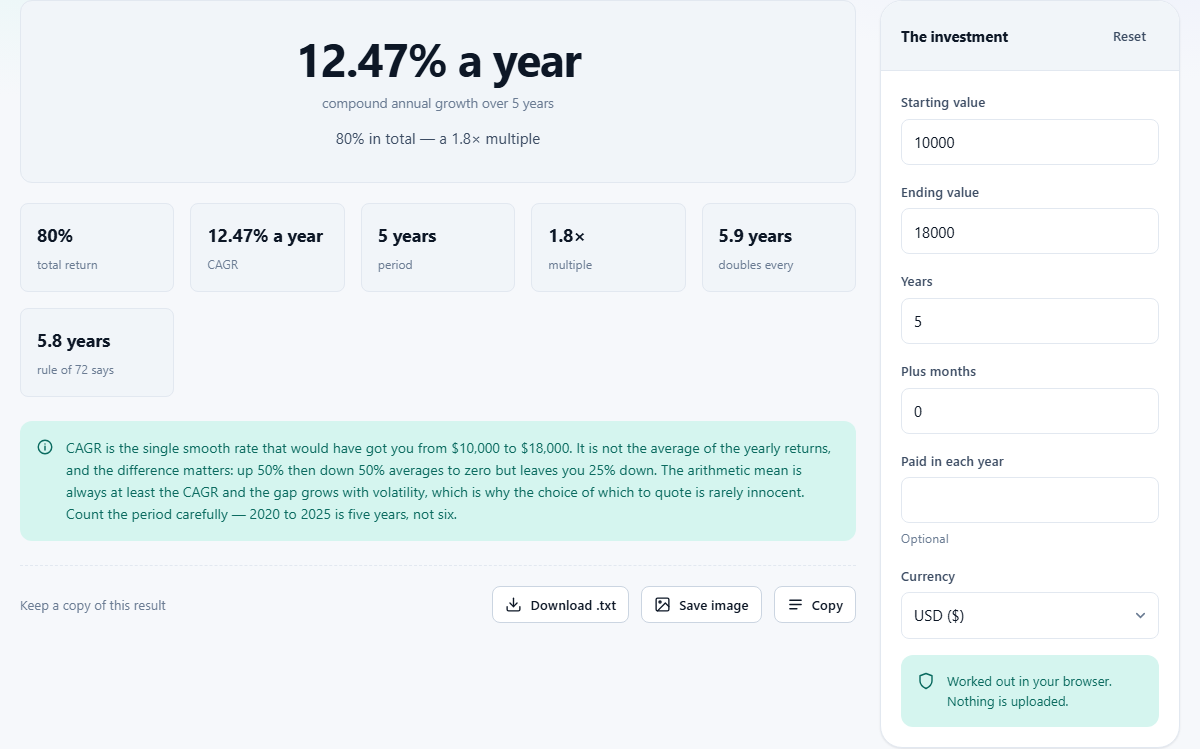
The panel on the right side of the page is headed The investment. It holds six fields, all of which update the result as soon as you change them.
Starting value is what the investment was worth at the beginning. It could be the amount you put in, the market price on a certain date, or a revenue figure from a past year. The default is 10,000.
Ending value is what it is worth now, or at the end of whatever period you are measuring. The default is 18,000.
Years is the whole number of years the period covers. Be careful here: from January 2020 to January 2025 is five years, not six. Counting wrong by one shifts the result by a noticeable amount. Plus months lets you add a fraction of a year. If your period is four years and seven months, enter 4 in Years and 7 in Plus months.
Paid in each year is optional. It covers the case where you were adding money along the way, such as a monthly contribution to a pension. Without this adjustment the calculator would credit your own deposits as investment growth, which makes the return look better than it really was.
Currency lets you pick a display currency for the result. It changes the symbol shown but does not convert between currencies.
What the output tells you
The result area shows several figures. The headline is the CAGR itself, expressed as a percentage. Below it you will find the total return over the whole period, the doubling time, and the Rule of 72 estimate of doubling time.
Total return is the overall gain or loss as a percentage, without breaking it into annual slices. If you started at 10,000 and ended at 18,000, the total return is 80 percent.
Doubling time is how many years it would take for the investment to double at the same annual rate. The exact figure is worked out from the CAGR using logarithms. Beside it sits the Rule of 72 figure, which is simply 72 divided by the percentage. The Rule of 72 is a mental shortcut that stays accurate up to about 20 percent and saves you from needing a calculator inside the calculator.
When the ending value is lower than the starting value, the CAGR comes out negative. In that case the doubling time is not meaningful and is not shown.
Worked example with real numbers
Suppose you bought shares worth 10,000 five years ago and they are now worth 18,000. Leave the defaults as they are: Starting value 10,000, Ending value 18,000, Years 5, Plus months 0. The calculator reports a CAGR of about 12.47 percent, a total return of 80 percent, and a doubling time near 5.9 years.
Now suppose you also put in 1,000 every year during those five years. Type 1000 in Paid in each year. The adjusted CAGR drops because the growth now has to account for the fact that 5,000 of the 18,000 came from your own pocket, not from market returns. The pure investment return on what was actually at risk is lower than the unadjusted number suggested.
Change the period to four years and six months by setting Years to 4 and Plus months to 6. The CAGR rises because the same 80 percent gain happened in less time. Every month you trim from the period pushes the annual rate up.
The gap between CAGR and average return
Fund fact sheets sometimes quote the arithmetic mean of annual returns instead of the CAGR, and the two numbers are never the same unless every year produced exactly the same result. The arithmetic mean is always equal to or higher than the CAGR, and the gap widens with volatility.
A fund that gained 30 percent then lost 10 percent has an arithmetic average of 10 percent, but a CAGR of about 8.2 percent. The second number is what your money actually did. The first is a statistical summary of the yearly figures. Knowing which one is being quoted matters every time someone puts a percentage on a slide deck.
Some reports also pick favourable start and end dates. A fund launched on a market low and measured on a market high will show a higher CAGR than one measured from peak to peak. The formula is honest, but the inputs choose the story.
When CAGR is not the right measure
CAGR works best when you put money in once at the start and took it out once at the end. The moment you have cash flowing in and out at irregular intervals, you need a different tool.
If you made monthly contributions, the Paid in each year field gives a rough adjustment that assumes even spacing. But if your payments varied in size or timing, the proper measure is the internal rate of return, often called XIRR, which needs every payment and its date. CAGR cannot handle that level of detail.
It also tells you nothing about the ride. Two investments can share the same CAGR while one climbed steadily and the other crashed and recovered. If you care about drawdowns, volatility, or the worst quarter along the way, you need more than a single number.
Common mistakes and how to avoid them
The most frequent error is getting the period wrong by one year. From 2018 to 2023 is five years, not six. It is the same mistake people make with fence posts and fence panels. Always count the gaps, not the posts.
Another trap is forgetting to account for contributions. If you started with 10,000 and ended with 20,000 but put in 5,000 along the way, the investment did not actually double. Leaving the Paid in each year field blank in that situation overstates the return. It makes a modest gain look like a spectacular one.
Mixing nominal and real values is a subtler problem. If your starting value is in today's pounds and your ending value is also in today's pounds, both adjusted for inflation, the result is a real return. If neither is adjusted, you get a nominal return. Both are fine as long as you do not mix them. The trap is using an inflation-adjusted start with a raw end figure, or the other way around, which produces a number that measures nothing meaningful.
Finally, do not compare CAGR across wildly different time spans and assume the longer one is safer. A five-year CAGR can look high because the start happened to land on a crash, while a twenty-year figure smooths that out. The length of the window shapes the answer almost as much as the performance itself.
Privacy and where the maths happens
The calculation runs entirely in your browser. No values are sent to a server, no data is stored between visits, and there is no account or login. The page works offline once it has loaded. If you are checking figures for a client or for your own business, nothing leaves your device. You can close the tab and every number you entered disappears.