
Converting blood sugar, cholesterol and other lab results between units
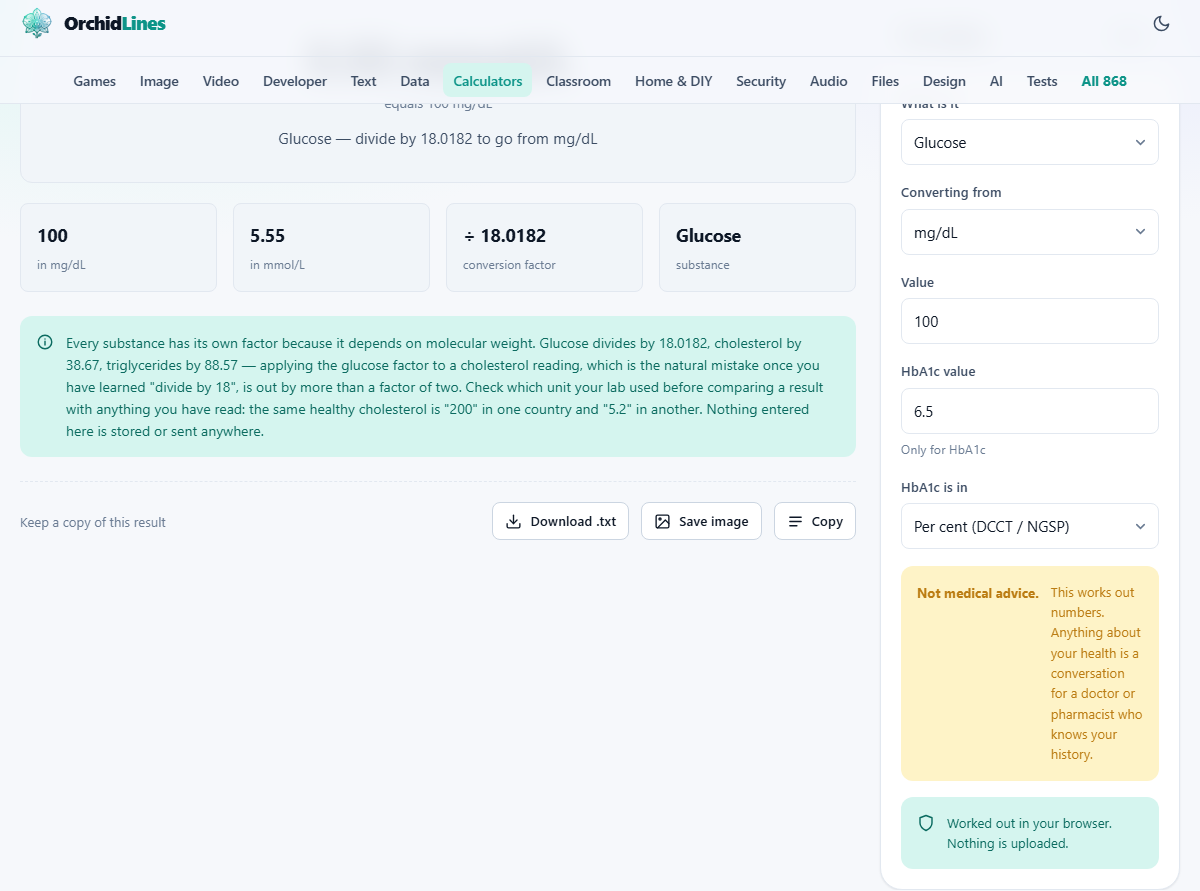
Lab results from different countries use different units for the same substance, and each substance has its own conversion factor because the factor depends on molecular weight. Using the glucose divisor on a cholesterol result gives an answer that is wrong by more than double. This article walks through an online converter that handles glucose, cholesterol, triglycerides, creatinine, urea and HbA1c, explains why each conversion is different, and shows a worked example for each. Nothing leaves your device. This is not medical advice.
Why two unit systems exist for blood tests
Most of the world uses SI units, which express concentrations in millimoles per litre, written mmol/L. The United States and a handful of other countries use conventional units, milligrams per decilitre, written mg/dL. Both describe the same amount of a substance in the same volume of blood, but they measure it in different ways: one counts molecules, the other weighs them.
Because the two systems measure different things, the conversion factor is not a simple constant. It depends on the molecular weight of the substance. Glucose, with a molecular weight of about 180, divides by 18 to go from mg/dL to mmol/L. Cholesterol, with a molecular weight of about 387, divides by roughly 38.67. Applying the wrong factor is the single most common mistake, and it produces an answer that looks plausible but is completely wrong.
Choosing the substance with the dropdown
The field labelled What is it offers eight choices: Glucose, HbA1c, Total cholesterol, HDL cholesterol, LDL cholesterol, Triglycerides, Creatinine, and Urea / BUN. Each one loads the correct molecular weight and conversion factor behind the scenes. You do not need to know the factor yourself, and you should not guess at it. The whole purpose of the dropdown is to keep the right factor locked to the right substance so that a mismatched division can never happen.
Glucose is selected by default because it is the most common reason someone needs this conversion. Patients with diabetes who travel between countries, or who read research papers and guidelines published in the other system, hit this need repeatedly. But cholesterol panels and kidney function tests are almost as common, and each has its own factor. HDL and LDL cholesterol share the same molecular weight and therefore the same conversion factor as total cholesterol, but they are listed separately so you can convert them without having to remember that detail.
Entering the value and choosing the source unit
The dropdown labelled Converting from has two options: mg/dL and mmol/L. Pick whichever unit your lab report is written in. If you are in the United States, that will almost always be mg/dL. If you are in the United Kingdom, Europe, Australia, or most of Asia, it will be mmol/L. Some labs print the unit directly after the number; others put it in a column header. Check carefully, because entering a value with the wrong source unit selected is the same as using the wrong formula.
The field labelled Value takes the number from your report. Enter it exactly as printed, including any decimal places. The result shows both units side by side so you can compare your reading against reference ranges published in either system. That dual display is the whole point: instead of remembering whether 5.5 mmol/L of glucose is high or low, you can see that it equals about 99 mg/dL and check it against whichever scale you are more familiar with. Both numbers update as you type, so you can experiment with values without pressing a button.
How HbA1c works differently from the rest
HbA1c is not a concentration. It is a measure of how much glucose has attached itself to your red blood cells over the past two or three months. It is expressed on two completely different scales: the DCCT/NGSP percentage scale used in the United States, and the IFCC scale measured in mmol/mol used in much of Europe and the rest of the world.
The relationship between the two is a linear formula, not a simple division. The IFCC value in mmol/mol equals the DCCT percentage minus 2.15, multiplied by 10.929. When you select HbA1c from the substance dropdown, the regular value and unit fields are replaced by the field labelled HbA1c value and a dropdown labelled HbA1c is in, which lets you choose between Per cent (DCCT / NGSP) and mmol/mol (IFCC).
The converter also reports an estimated average glucose, often called eAG. This is the blood sugar level that the HbA1c implies as a three-month average. It comes from a regression equation published in the 2008 ADAG study. Keep in mind that it is a population average: individual variation means your personal average glucose might sit well above or below the figure the formula produces.
Worked examples for glucose and cholesterol
Start with glucose. Select Glucose, set Converting from to mg/dL, and enter 126 in the Value field. The converter shows that 126 mg/dL equals about 7.0 mmol/L. That number sits right at the diagnostic threshold for diabetes in both unit systems, which is why it is a useful test case.
Now switch the substance to Total cholesterol and enter 200 in mg/dL. The converter shows about 5.17 mmol/L. If you had mistakenly used the glucose factor of 18 instead of the cholesterol factor of 38.67, you would get 11.1, which would look like a dangerously high cholesterol when in fact 200 mg/dL is right at the borderline of desirable. This one mistake accounts for most of the panicked forum posts about impossible cholesterol numbers.
For creatinine, the surprise goes the other way. Creatinine is reported in micromoles per litre rather than millimoles, so the metric number is the larger one. A creatinine of 1.0 mg/dL converts to about 88.4 micromol/L. The converter handles this automatically; you do not need to adjust the scale yourself.
The reference bands and their limits
The output includes common reference ranges alongside the converted value so you can see at a glance where your number falls. These are the standard diagnostic thresholds used by most laboratories. For glucose, that means fasting values below 100 mg/dL or 5.6 mmol/L are normal, 100 to 125 or 5.6 to 6.9 is pre-diabetes, and 126 or 7.0 and above is the diabetes threshold.
But these bands are guidelines, not verdicts. What a particular result means for you depends on the context: whether you were fasting, what medication you take, your age, and the rest of your test results. A single number in isolation tells very little. The tool places a warning on the panel that reads Not medical advice, and that warning should be taken seriously. A doctor who knows your history is the right person to interpret results, not a converter.
Mistakes that produce wrong conversions
The most damaging mistake is using the wrong substance. Every factor is substance-specific, and there is no way to detect the error from the numbers alone. If you select glucose but enter a cholesterol value, the answer will be wrong and will look completely reasonable.
Another frequent error is confusing mg/dL with mg/L or mmol/L with micromol/L. Creatinine in particular trips people up because some labs report it in micromol/L while the converter expects you to select the right substance, which internally accounts for the micro prefix. If your lab result has an unusual unit, check the printout carefully before entering it.
For HbA1c, the most common slip is entering a percentage value into the IFCC field or the other way around. An HbA1c of 6.5 per cent is normal to slightly elevated, but 6.5 mmol/mol would be far below any realistic reading. The scales do not overlap in the ranges that matter, so an implausible result is a strong hint that the wrong scale was selected.
When this converter is not enough
This tool covers the most common analytes found on routine blood panels. More specialised tests, such as thyroid hormones, liver enzymes, or iron studies, have their own conversion factors that are not included here. If your lab report lists a substance that does not appear in the dropdown, search for the specific conversion factor by substance name rather than trying to reuse one from this page.
The converter also does not interpret trends. A single fasting glucose of 110 mg/dL means one thing if it is a one-off after a heavy meal the night before and something very different if it has been climbing steadily over three years. Interpretation belongs to a medical professional who can see the full picture.
Privacy and where the maths happens
Every conversion runs entirely in your browser. No lab values are sent to any server, no readings are stored, and no account is required. Health data is deeply personal, and this tool is built so that yours never leaves your device. Press Reset to clear every field and start a fresh conversion.