
Understanding blood pressure categories under two major guidelines
A blood pressure monitor gives you two numbers, but turning those numbers into a category is less obvious than it looks. Two widely used guideline sets disagree on where normal ends and high begins, and the category is always set by whichever of the two numbers is worse, not by the top one alone. This article explains what the numbers mean, how the checker works, and what to do with the result. This is not medical advice. Everything runs on your own device.
What the two numbers actually measure
The upper number, called systolic, is the pressure in your arteries at the moment the heart squeezes. The lower number, called diastolic, is the pressure between beats when the heart is relaxed. Both are measured in millimetres of mercury, written mmHg, a unit left over from the days when the gauge was literally a column of mercury.
Neither number is more important than the other. Doctors used to pay most attention to the systolic reading, especially in older patients, but current guidelines treat both as independent risk factors. A reading of 118 over 95 has a perfectly normal upper number and a clearly elevated lower number, and the category is set by the worse of the two. Any chart that only colours the systolic column hides this completely.
The two guideline schemes and why they differ
The checker classifies each reading under two systems at once. The 2017 ACC/AHA scheme, used in the United States, defines normal as below 120 over 80, elevated as 120 to 129 over less than 80, stage 1 hypertension as 130 to 139 or 80 to 89, and stage 2 as 140 and above or 90 and above. Anything at or above 180 over 120 is a hypertensive crisis.
The European scheme, used across much of the rest of the world, sets a higher threshold. It calls readings up to 139 over 89 either optimal, normal, or high normal depending on where they fall, and reserves the word hypertension for 140 over 90 and above. The practical effect is that a reading of 135 over 85 is labelled stage 1 hypertension under the American system and high normal under the European one.
The reason for the split is a deliberate policy choice. The American revision lowered its cutoffs in 2017 to encourage earlier lifestyle changes such as exercise and salt reduction. Europe kept the older thresholds on the grounds that medication decisions should begin at 140 over 90. Both are current, peer-reviewed recommendations, and which one matters to you depends on who is treating you.
Entering a reading and the optional fields
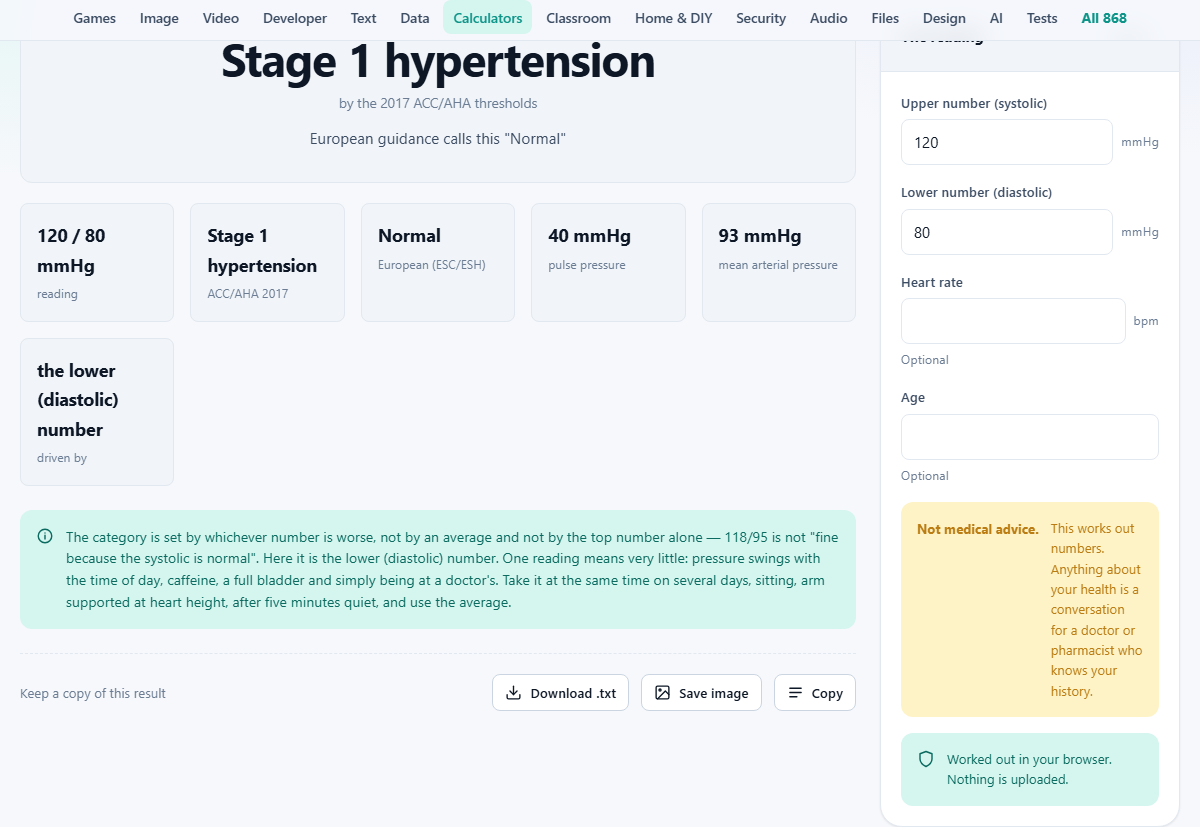
The field labelled Upper number (systolic) takes the first number your monitor shows, in mmHg. The field labelled Lower number (diastolic) takes the second. Both default to 120 and 80, which is right on the boundary between normal and elevated in the American scheme.
Two optional fields appear below. Heart rate accepts your pulse in beats per minute if your monitor displays it. This is not used for the blood pressure category itself, but it is included in the output alongside the computed values. Age is also optional and helps give context when interpreting the results, since what counts as a concern varies across age groups.
A prominent warning on the panel says Not medical advice. That warning is there for a good reason. The tool places a reading in a category. What that category means for your health depends on your full medical history, your medications, and a pattern of readings over time, none of which a calculator can know.
The output: categories, pulse pressure, and mean arterial pressure
The result panel shows the category under both the ACC/AHA and European schemes side by side. It also names which of the two numbers drove the classification. If both numbers land in the same category, it says both. If they land in different categories, it says which one pushed the result higher. This detail is surprisingly useful because it tells you which aspect of your cardiovascular health is doing the work. Someone whose diastolic is consistently the problem might hear different lifestyle advice from someone whose systolic is the concern.
Pulse pressure is the gap between the two numbers. A systolic of 140 and a diastolic of 70 gives a pulse pressure of 70 mmHg. A healthy pulse pressure typically sits between 30 and 50. In older people a wide pulse pressure can indicate stiffened arteries, and it is worth bringing up with a doctor even if the overall category looks moderate. A very narrow pulse pressure can also be clinically relevant, though the causes are different.
Mean arterial pressure is a weighted average: roughly one-third systolic plus two-thirds diastolic. It represents the average pressure pushing blood through the organs during a full cardiac cycle. Doctors sometimes use it in critical care settings to judge whether organs are receiving enough blood flow, and seeing it alongside the category saves a separate calculation.
A worked example with two contrasting readings
Enter 118 for the upper number and 75 for the lower. Under ACC/AHA that falls in the normal range because both numbers are below 120 and 80. Under the European scheme it is also optimal. The pulse pressure is 43, which sits comfortably in the healthy band between 30 and 50. The mean arterial pressure is about 89. The driving number is neither because both are in the lowest category.
Now change the lower number to 92. The upper number is still a comfortable 118, but the diastolic of 92 puts the reading at stage 2 under ACC/AHA and grade 1 hypertension under the European scheme. The driving factor is the lower number. This is the exact scenario the tool is designed to catch, because many people assume a normal top number means the whole reading is fine.
For a third comparison, enter 145 over 88. Both guidelines now agree that this is hypertension, but the driving factor shifts to the upper number because 145 is the further outlier. Seeing which number is responsible over multiple readings can reveal whether isolated systolic hypertension, isolated diastolic elevation, or both together is the pattern.
Getting a reliable reading in the first place
A single measurement means very little. Blood pressure changes throughout the day, rises after caffeine or a full bladder, and goes up simply from being in a medical setting, a phenomenon called white coat hypertension. For a meaningful picture, measure at the same time each day over several days, ideally morning and evening, and take the average.
Posture matters more than most people realise. Sit with your back supported, feet flat on the floor, and arm resting at heart height on a table. Letting your arm dangle at your side can add about ten mmHg to the reading. Do not talk during the measurement, and sit quietly for five minutes before you start.
Measure both arms the first few times. A persistent difference of more than ten mmHg between the left and right arms is something to mention to a doctor. After that, use whichever arm consistently reads higher.
When to treat this as urgent
A reading at or above 180 over 120 is a hypertensive crisis. If you see that, rest for five minutes and measure again. If it is still that high, seek help promptly. If there is also chest pain, difficulty breathing, weakness on one side, or trouble speaking, call emergency services immediately. The tool does not flash red lights or play alarms, but the text makes the severity clear.
At the other end, a very low reading such as 85 over 55 is not categorised as a problem by either guideline because the schemes are designed for high blood pressure. If you feel dizzy, faint, or unwell at a low reading, that is also a conversation for a doctor, but it is outside the scope of a category checker.
Privacy and storage
Nothing you type is sent anywhere. The numbers stay in your browser and vanish when you close the tab or press Reset. No account is needed and no readings are saved. Health data is among the most personal information a person has, and this tool is designed so that none of it ever leaves your device.
If you want a log of your measurements over time, keep a paper diary or use a dedicated blood pressure tracking app. The trend over weeks and months is what a doctor actually wants to see, not a single snapshot. Bring that log to your next appointment and the conversation will be far more productive than any number a category checker can give you.