
Reading an A/B test result without fooling yourself
Running an A/B test is easy. Reading the result honestly is not. Most people look at two percentages, see that one is bigger, and call it a winner. This article explains what the calculator actually computes, what each control does, how to read the confidence interval that matters more than the verdict, and the mistakes that turn a fair test into an expensive coin flip.
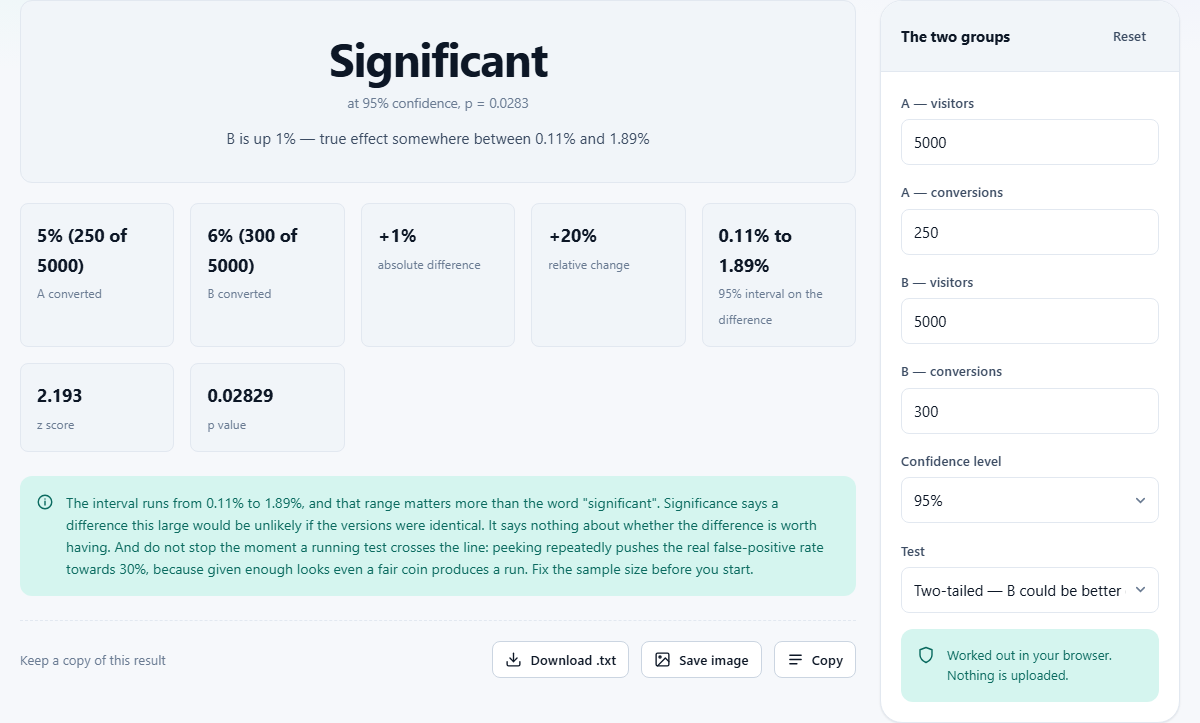
What this calculator does
You ran two versions of a page, an email, or an ad. Version A was shown to one group and version B to another. Each group had a certain number of visitors and a certain number of conversions. A conversion is whatever you are measuring: a purchase, a signup, a click, a form submission.
The calculator takes those four raw counts and answers a simple question: could the difference between the two conversion rates have happened by luck alone? It gives a p value, which is the probability of seeing a difference at least this large if the two versions were truly identical. It also gives a confidence interval on the difference itself, which is the range in which the true effect probably sits.
The six inputs and what they mean
A -- visitors is the total number of people who saw version A. A -- conversions is how many of those people did the thing you are measuring. B -- visitors and B -- conversions are the same two numbers for version B. Enter raw counts, not percentages. The calculator works out the rates itself.
Confidence level is usually left at 95 per cent, which is the standard in most industries. Choosing 90 per cent makes the test easier to pass, meaning it calls differences significant more often, but it also means a higher chance of being wrong. Choosing 99 per cent is stricter and demands larger samples before it will declare anything significant.
Test offers two choices. Two-tailed, the default, tests whether B is different from A in either direction. It catches both improvements and declines. One-tailed tests only for improvement and is more sensitive in that one direction, but if B is actually worse, a one-tailed test treats that the same as no difference. Use two-tailed unless you have a strong reason not to.
A worked example with real numbers
You tested two versions of a landing page. Version A had 5000 visitors and 250 conversions, a rate of 5 per cent. Version B had 5000 visitors and 300 conversions, a rate of 6 per cent. The question is whether that one percentage point gap is real or just noise.
Enter those numbers with the confidence level at 95 per cent and the test set to two-tailed. The calculator reports a p value of about 0.028 and declares the difference statistically significant. The confidence interval on the difference runs from roughly 0.1 to 1.9 percentage points.
That interval is the important part. It says the true improvement could be as small as a tenth of a point or as large as nearly two points. Whether that range contains numbers worth acting on is a business decision, not a statistical one.
Why the confidence interval matters more than the verdict
The word significant is deeply misleading. In everyday English it means important. In statistics it means unlikely by chance. A difference can be statistically significant and practically worthless.
Suppose you run a test with a million visitors in each group. Group A converts at 5.000 per cent and group B at 5.012 per cent. The test will almost certainly call that significant, because with a million data points even tiny differences are unlikely to be pure luck. But 0.012 percentage points is not worth changing a page for.
The confidence interval tells you the size of the effect. If the interval runs from 0.001 to 0.023 percentage points, you know the effect is real but tiny. If it runs from 0.5 to 2.0 percentage points, you know the effect is both real and large enough to care about. The interval is the answer. The significant label is just a shortcut that hides it.
The peeking problem
The most damaging mistake in A/B testing is checking the result every day and stopping the moment the test crosses the significance line. This feels reasonable: why keep running a test that has already given an answer?
The reason is that repeated checking inflates the false-positive rate. A test set to 95 per cent confidence has a 5 per cent chance of a false positive if you look once at the end. If you look every day for two weeks, the real false-positive rate climbs toward 25 or 30 per cent. You are not running one test. You are running fourteen overlapping tests and keeping the best result.
The fix is to decide the sample size before the test starts and wait until you reach it. If your test needs 10,000 visitors per group, run it until both groups hit 10,000 and look at the result once. Peeking before that is not cheating on purpose, but it has the same effect.
Not significant does not mean no difference
When the calculator says the result is not statistically significant, many people read that as proof the two versions are the same. That is not what it means. It means the test could not tell, given the amount of data it had.
Look at the confidence interval. If it runs from minus 2 to plus 4 percentage points, a real and valuable improvement might be hiding in there, but the test was not large enough to pin it down. The honest conclusion is not that there is no effect. It is that you do not know yet.
The solution is more data. If the interval is wide, either run the test longer or accept that you cannot answer the question at this sample size. Do not conclude the versions are equal just because the test did not reject that possibility.
Small counts and the normal approximation
The calculator uses a normal approximation to the binomial distribution, which works well when both groups have at least five conversions and at least five non-conversions. Below that threshold the maths stops being reliable, and the page warns you.
If your test has only three conversions in one group, you do not have enough data for any statistical test to say anything useful. The confidence interval would be so wide it would include everything from a large decline to a large improvement. Run the test longer before trying to read the result.
One-tailed versus two-tailed and when it matters
A two-tailed test asks whether B is different from A. A one-tailed test asks whether B is better than A. The one-tailed test is more sensitive, meaning it reaches significance with less data, but it has a blind spot: if B is actually worse, it reports no difference rather than a decline.
Use two-tailed as a default. Switch to one-tailed only if you genuinely would not care about a decline, which is rare. In most real situations, discovering that your new page is worse than the old one is just as valuable as discovering it is better. A two-tailed test catches both, and the cost is a slightly higher sample size requirement.
Common mistakes beyond peeking
Running the test for less than a full week misses the difference between weekday and weekend traffic. Conversion rates often vary by day of the week, and a test that ran from Monday to Thursday may give a different answer from one that ran Monday to Monday.
Changing the page during the test invalidates the result. If you updated the headline on day three, the first two days of data are about a different version than the last five days. Start over.
Splitting traffic unevenly is not wrong, but it changes the maths. If group A got 8000 visitors and group B got 2000, the confidence interval for B is much wider. Equal splits give the most statistical power for a given total sample.
Deciding sample size before you start
The best time to think about sample size is before the test begins, not after. If your current conversion rate is 5 per cent and you want to detect a lift to 6 per cent at 95 per cent confidence with 80 per cent power, each group needs about 8,200 visitors. Knowing that number up front tells you how long the test must run.
If your site gets 500 visitors a day and you split them evenly, each group gets 250 a day. To reach 8,200 per group you need about 33 days. Plan for that. Chasing a smaller lift is worse than it sounds: halve the gap you want to catch and the sample roughly quadruples. If you cannot wait, either accept a lower confidence level or only test for larger effects. There is no shortcut that preserves the quality of the answer.
Where your numbers stay
The calculation runs entirely in your browser. No visitor counts, conversion numbers, or test results are sent anywhere. The page works offline once loaded. Your business data stays on your own device.