
Sizing a solar array from your electricity bill
What peak sun hours are and why they are not the same as daylight, how to read the inputs on the panel, how orientation and losses shrink the headline number, and when a battery earns its keep.
Peak sun hours, not daylight hours
A solar panel is rated at its peak output under a standard test condition of 1,000 watts per square metre. That full strength only arrives for part of the day. Early morning and late afternoon sun is weaker. Cloud cuts it further. Winter shortens the window.
Peak sun hours wrap all of that into a single number. It is the count of hours each day that would deliver the same total energy if the sun stayed at full strength the whole time. London averages about 2.9 peak sun hours over the year. Phoenix averages about 5.7.
The difference between peak sun hours and daylight hours is large. London gets roughly 12 hours of daylight on a summer day, but only about 5 peak sun hours even in June, because the sun is weak at each end. Multiply panel rating by raw daylight and you will overstate the output by about four or five times.
Starting from a bill
The first field asks for yearly electricity use in kilowatt hours. An annual statement from your supplier gives this directly. A typical UK home uses 2,700 to 3,500 kWh. A household with an electric car or a heat pump can use double that.
If you only have monthly figures, multiply a recent bill by 12 for a rough annual total. Bear in mind that winter months are higher and summer months lower, so one month multiplied up will not be exact.
The yearly figure is the target the calculator tries to match. It sizes the array so that the total annual output covers the total annual use. That does not mean the house is off grid, because the output falls in summer and the demand rises in winter, but it is the standard way to compare array sizes.
Region, orientation and the numbers beside them
Where you are sets the average daily peak sun hours. The list covers broad bands from northern UK at 2.4 up to southern US and Australia at around 5. Pick the one closest to your location.
Roof orientation carries a factor. A south facing roof at a good pitch scores 1.00, meaning no penalty. South-east or south-west drops to 0.95. A flat roof scores 0.88. East or west facing comes in at 0.82, which is not the disaster many people expect. It spreads the generation more evenly across the day, which can actually suit a household that uses power in the morning and evening.
A north facing roof scores 0.60. It still generates power, but the output is low enough that most installers would suggest looking at another part of the building. If the only available roof faces north, a ground-mounted array in the garden may be worth considering instead.
Panel count and rating
The panel rating defaults to 430 watts, which is a common size for modern residential panels. If you already have a quote that names a different panel, change it here.
The number of panels field can be left blank. When it is empty the calculator works backwards from your yearly usage and tells you how many panels you need. Fill it in instead if you want to see what a specific number of panels will produce.
For a UK home using 3,500 kWh a year, a south facing roof in the south of England typically needs 9 to 11 panels of 430 watts. That gives an array of about 4 kilowatts peak.
Panels have grown quickly over the past few years. Older installations might use 250 or 300 watt panels, which means more panels for the same output. If you are comparing a new quote against an existing system, put the old panel size in and compare the totals rather than the counts.
System efficiency and shading
No solar system delivers the full rated output. The inverter takes a slice. The wiring loses a little. The panels get hot in summer and lose efficiency. Dust and bird droppings accumulate. All of these are bundled into the system efficiency field, which defaults to 80 per cent.
Shading loss is separate and defaults to zero. If a chimney, a tree or a neighbouring roof casts a shadow on the panels for part of the day, raise this figure. Even a small shadow can have a large effect because shaded cells in a string drag down the whole string.
Together these two fields turn the headline panel output into a realistic figure. An array rated at 4 kilowatts peak with 80 per cent efficiency and 10 per cent shading will deliver about 72 per cent of its name. The calculator applies both automatically.
Battery sizing
The battery fields are optional. Fill in the nameplate capacity in kilowatt hours and the calculator works out the usable capacity after depth of discharge and round-trip efficiency are taken off.
Depth of discharge is how much of the battery you can actually drain before the management system stops you. Most lithium batteries allow about 90 per cent. Round-trip efficiency is the fraction of energy you get back out after putting it in and taking it out again, also typically around 90 per cent.
A battery labelled 10 kWh, once both losses are applied, gives about 8.1 kWh of usable storage. The calculator shows this adjusted figure rather than the marketing number.
Size the battery for one evening, not for the winter. Roughly 55 per cent of a day's use is the practical sweet spot. A larger battery stops filling on all but the sunniest days, so the extra capacity sits idle and earns nothing.
Why 100 per cent coverage is not self-sufficiency
An array that matches your yearly total sounds like independence. It is not. The panels produce far more than you need in June and far less than you need in December. No domestic battery can store six months of surplus.
In practice you will export power in summer and import it in winter. Whether a battery helps depends on the gap between your import price and your export price. Where export pays nearly as much as import, the battery barely earns back its cost. Where export pays very little, storing a day's surplus for the evening is worth doing.
The calculator gives the yearly balance. A separate financial model, one that accounts for tariffs, standing charges and degradation, is needed to judge payback.
Walking through a typical home
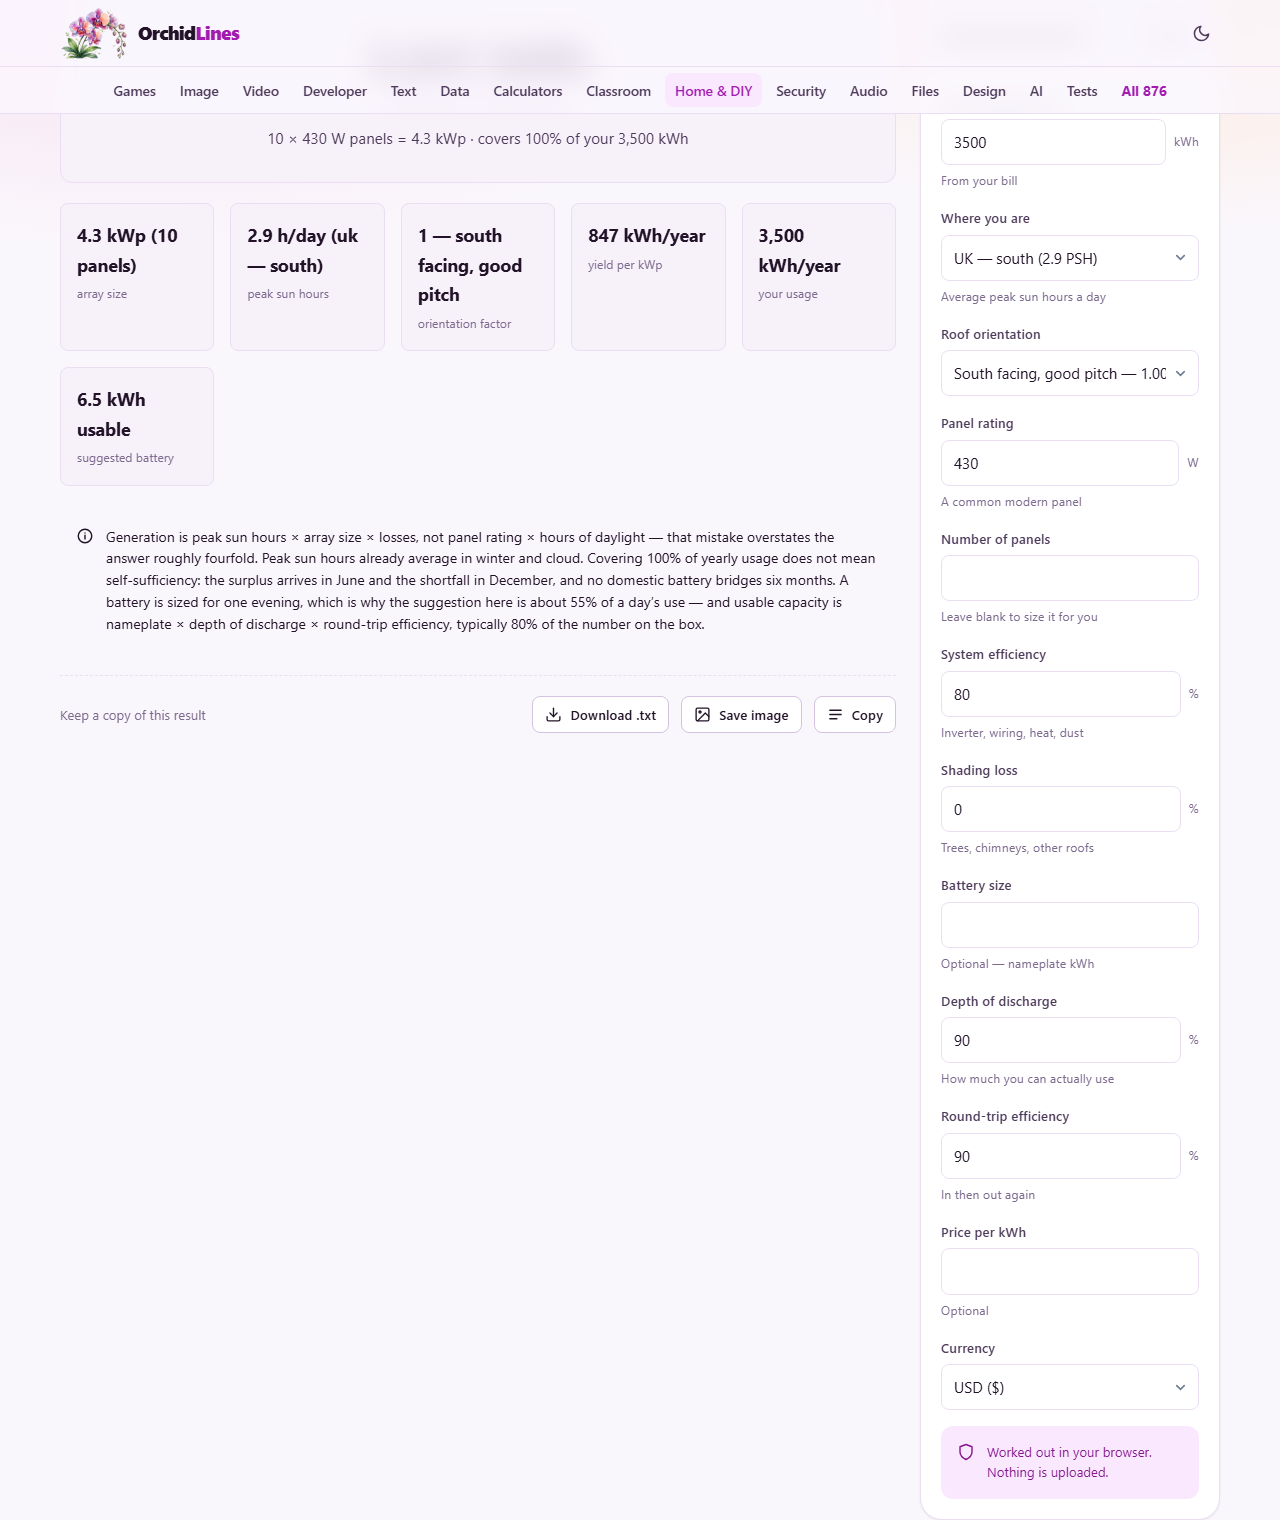
A house in the south of England uses 3,500 kWh a year. The roof faces south-west at a good pitch, so the orientation factor is 0.95. Peak sun hours for southern UK are 2.9. System efficiency is 80 per cent and there is no shading.
Leaving the panel count blank, the calculator sizes the array at about 10 panels of 430 watts, giving roughly 4.3 kilowatts peak. The estimated yearly output comes close to the 3,500 kWh target.
Adding a 10 kWh battery with 90 per cent depth of discharge and 90 per cent round-trip efficiency gives 8.1 kWh of usable storage. That is enough for an evening's worth of lighting, cooking and entertainment before the house falls back on the grid.
Now try the same home in southern Europe, where peak sun hours jump to 4.5. The panel count drops to about 7, and the annual output still covers the same bill. Location makes a bigger difference than almost any equipment choice.
Assumptions the calculator does not make
Peak sun hours are long-run averages. A single year can be 10 per cent higher or lower. The calculator does not model panel degradation, which is typically about half a per cent a year. It does not model inverter clipping, which matters when the array is oversized relative to the inverter. And it does not model export tariffs or time-of-use pricing.
It is an estimate, not a design. An accredited installer will survey the roof, check the structure, model shading properly and size the inverter. Use this tool to arrive at that conversation with a sensible starting figure rather than no figure at all.
Your figures never leave your device
The entire calculation runs in your browser. Your electricity use, your roof details and your battery numbers are not sent anywhere. There is no login, no cloud account, and nothing saved on a remote server. You can disconnect from the network after the page loads and everything still works, because the arithmetic does not depend on anything outside your own machine.