
Writing a flowchart in plain text and letting it lay itself out
The help above shows the basic idea: write lines of text, and the picture draws itself. This guide is the full reference. It covers the small set of rules the text follows, every shape and label you can add, what the look settings do, and the difference between the two ways of saving. A step by step example and a fault list finish the page.
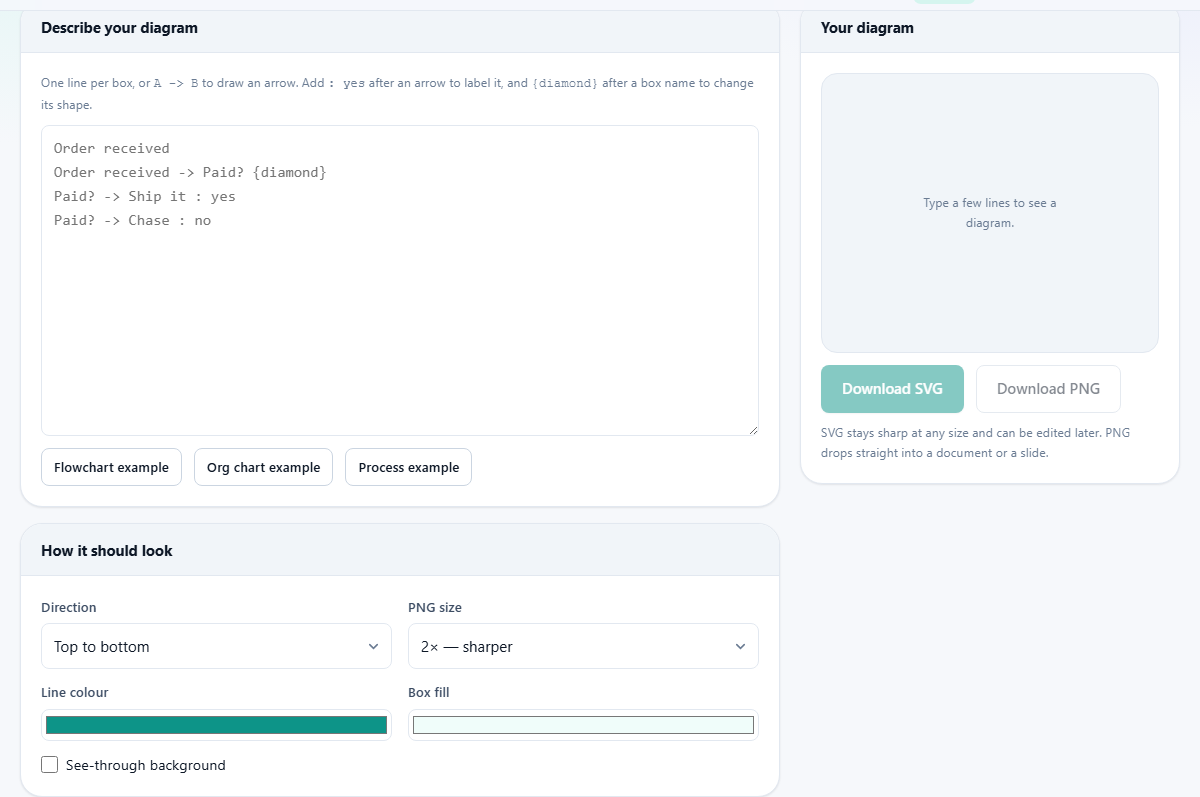
A diagram you type instead of draw
Most drawing tools ask you to place each box by hand and pull arrows between them. That is slow, and changing your mind means moving everything again. This tool works the other way round. You describe the diagram in plain text, and it works out the layout for you.
It suits a flowchart for a process, a small org chart, an onboarding checklist, or the steps in a decision. Anything made of boxes joined by arrows fits. The picture is redrawn each time you type, and it always comes out evenly spaced, so you spend your time on the thinking rather than the tidying.
The one rule: a box per line
Start by writing your boxes, one to a line. The words on the line become the words in the box. No quotes, no dashes, nothing else is needed.
Type three lines and you get three separate boxes. On its own that is not much use, so the next step is to join them together.
Arrows join the boxes
To draw an arrow, write two box names with an arrow made from a dash and a greater-than sign between them, like Order received -> Ship it. An arrow appears, pointing from the first box to the second.
You do not have to list the boxes first. Any name you mention in an arrow line is created for you if it is new. Many people never write a plain box line at all, and simply describe the arrows.
Two arrows can point at the same box, and a box can point back to an earlier one to make a loop, such as a rejected order returning to the start. Loops are ordinary in a flowchart, and the layout handles them without hanging or complaint.
Labelling an arrow
A decision usually needs its branches marked yes and no. Add a colon and the label at the end of an arrow line: Paid? -> Ship it : yes. The word after the colon is drawn on the arrow in a small box.
The colon only counts when it comes after the arrow, so a colon inside a box's own name is left untouched.
Changing a box's shape
Every box is a rectangle unless you say otherwise. To change one, put a shape name in curly braces after the box name.
Write {diamond} for a decision, the diamond shape everyone reads as a question. Write {round} for a start or end box, which is given soft rounded ends. A circle is understood too, with {circle}. The shape stays with that box wherever you mention it again.
A line that begins with a hash mark is treated as a note to yourself and is left out of the picture. It is handy for parking a line you might want back later without deleting it.
The three example buttons
Under the text box sit three buttons: Flowchart example, Org chart example, and Process example. Each one fills the box with a small working diagram and draws it straight away.
They are the quickest way to learn the format. Load one, read how the lines turn into the picture, then swap the words for your own. It is far easier than starting from a blank box and guessing.
The flowchart example shows an order being paid for and shipped, with a decision in the middle. The org chart example is a small school, drawn from the top down. The process example is a build loop, where a failed test sends the work back a step. Between them they show a decision, a hierarchy, and a loop.
Why the boxes sit where they do
It helps to know roughly how the picture is arranged, because it explains why boxes land where they do. Each box is given a level. A box with nothing pointing at it starts at the top, or on the left in a left to right chart. Every other box sits one step deeper than the deepest box that points to it.
Within each row, the boxes are then ordered to sit near the ones they connect to. That keeps the arrows short and stops them crossing over each other. You do not set any of this by hand, and you rarely need to. Writing your lines in a sensible order is usually all it takes to get a clean result.
How it should look
The 'How it should look' panel holds a handful of settings that change the drawing without touching your text.
- Direction is Top to bottom or Left to right. Top to bottom suits a process that flows downward. Left to right often reads better for an org chart or a timeline, and copes better with long names.
- Line colour sets the colour of the box outlines and the arrows. It starts on a teal green.
- Box fill sets the colour inside the boxes. It starts on a very pale green.
- See-through background leaves the page clear instead of white, so the diagram sits cleanly on a coloured slide or document.
- PNG size chooses how large the saved image is: Normal, two times for a sharper picture, or three times for print. It changes only the PNG download, not the preview or the SVG.
Saving the picture
A grey line under the preview keeps a running count, such as six boxes and five arrows, so you can watch the diagram grow. The two save buttons stay greyed out until there is at least one box to save.
Download SVG saves the picture as diagram.svg. SVG is a vector format, which means it is stored as shapes rather than dots, so it stays perfectly sharp at any size and can be edited later in a drawing program. It is the right choice for anything you might print large or come back to.
Download PNG saves it as diagram.png, an ordinary image at the size set in the PNG size menu. Pick this to drop the diagram straight into a document, an email, or a slide.
A worked example
Suppose you want a returns process. In the text box type: Return received. On the next line, Return received -> Item damaged? {diamond}. Then Item damaged? -> Refund : yes, and Item damaged? -> Send back : no.
As you type, four boxes appear. 'Item damaged?' is drawn as a diamond, with two arrows leaving it, labelled yes and no. The count line reads four boxes and three arrows.
Add one more line, Refund -> Done {round}, and a rounded end box joins on. Set Direction to Top to bottom, leave the colours alone, and press Download PNG. The file diagram.png lands in your downloads at twice its screen size, ready to paste into a report.
If it looked cramped in the report, you could press Download SVG instead and open that at any size without it going blurry. Both buttons save the very same picture; only the file type is different.
Common mistakes
Nearly every problem is a slip in the text, and each has a quick fix.
- Two boxes will not join. The arrow was mistyped. It must be a dash then a greater-than sign, with a name on each side.
- A label went missing. The colon was before the arrow instead of after it. A label only counts at the end of an arrow line.
- The boxes jumped when you added a line. That is meant to happen. The whole layout is worked out again on every change so it stays tidy, which is why you never line anything up by hand.
- A box you wanted is missing. It was only named on a comment line starting with a hash, so it was left out of the drawing.
- The chart is too wide to read. Switch Direction to Left to right, which usually reads better when there are many boxes across.
When Diagram Studio fits better
This tool decides the layout for you. That is both its strength and its limit. If you need to place boxes exactly where you want them, use many kinds of shape, or move things around by hand, Diagram Studio on this site is the fuller editor for that kind of work.
And if your picture is really a branching outline, with one centre and topics spreading out from it, a mind map tool draws that shape better than a flowchart ever could.
Drawn on your device
The whole diagram is read and drawn inside your browser. None of your text is sent anywhere, which is worth knowing when the boxes name internal steps, systems, or the people who run them.
There is no sign in and no account to save to. When you are happy with the picture, download it. When you close the tab the text goes with it, so keep your own copy of anything you may want to return to.