
Drawing a diagram by hand, with shapes that snap and lines that hold
The help above gives the five steps and the promise that nothing is uploaded. This guide is the full tour. It walks through the shape library, how connectors attach and stay attached, every setting in the properties panel, the templates, and the ways the tool saves and exports. A worked example and a shortcut list come near the end.
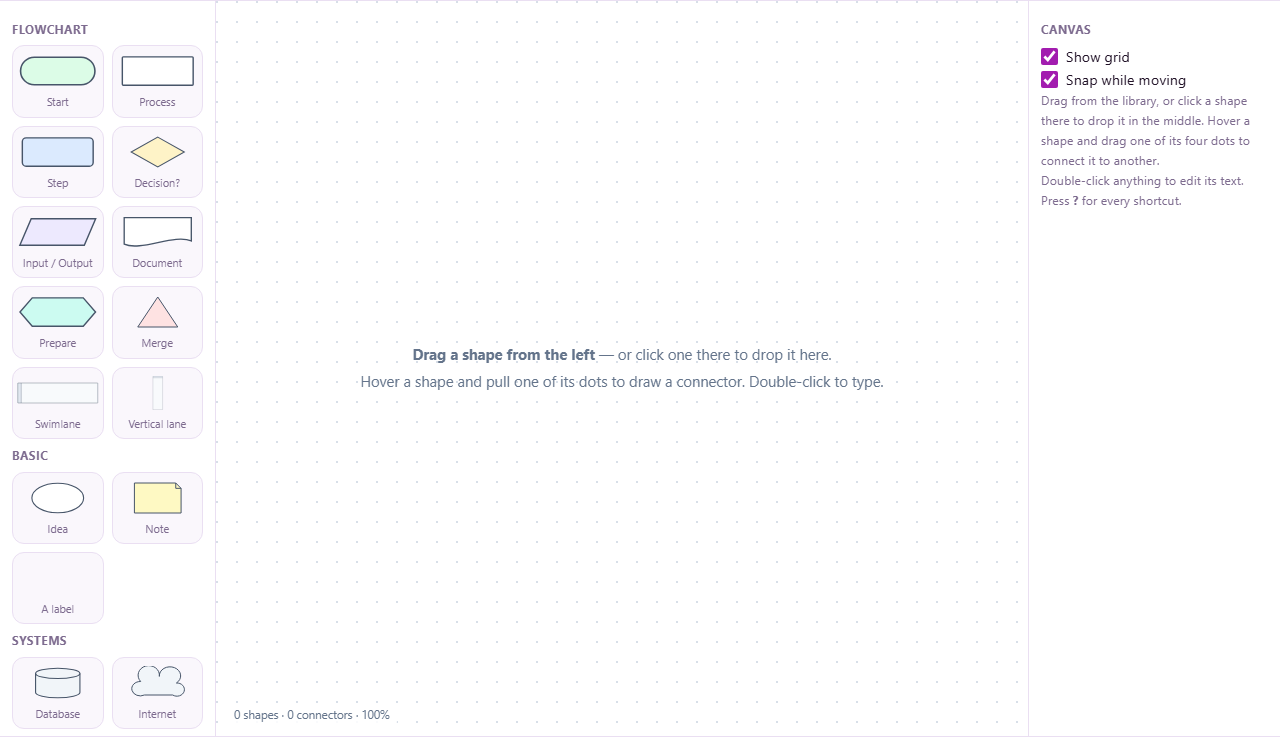
A full diagram editor in a browser tab
Some diagrams are easier to point at than to describe. When you want to drag boxes exactly where they belong, mix many shapes, and nudge things until they look right, this is the tool for it. It is a proper drag and drop editor that runs inside the page, with no account to make and nothing to install.
It handles flowcharts, org charts, network maps, database sketches, and sequence diagrams. The workspace has three parts: a shape library down the left, a white canvas in the middle, and a properties panel on the right that changes to match whatever you have selected.
The canvas is always white, even when the rest of the site is in dark mode. That is on purpose, because the exported picture is white too, and the editor should show you exactly what you will get.
The shape library
The library sorts the shapes into four sets. Drag any shape onto the canvas, or click it to drop one in the middle.
- Flowchart: Start, Process, Step, Decision, Input / Output, Document, Prepare, Merge, and two swimlanes, one running across and one running down.
- Basic: Idea, Note, and a plain text label with no box around it.
- Systems: Database, Internet cloud, User, Server, Router, and Laptop.
- UML: a three-part class box, and a sequence lifeline with a dashed line hanging below it.
Dropping shapes and joining them
Add a shape by dragging it from the library, or by clicking it there to drop one in the centre of the canvas. Move a shape by dragging its body, and resize it by dragging a corner.
To join two shapes, rest the mouse on the first one. Four small dots appear on its edges. Drag from a dot onto the second shape, and a connector snaps between them. The important part is what comes next: the connector is tied to the shapes, not to a spot on the canvas. Move either shape and the line follows and finds a new route on its own.
To change where an existing line goes, select it and drag either end onto a different shape. To write in a shape or on a line, double-click it, or press F2, and type. The words wrap to fit by themselves.
Lining things up neatly
You do not have to line things up by eye. As you drag a shape near a neighbour, an orange guide line flashes when their edges or centres match, and the shape clicks into place. A faint grid sits behind everything to help as well.
With the canvas itself selected, the properties panel offers two tick boxes, Show grid and Snap while moving. Turn snapping off when you want to place something freely.
Select two or more shapes and an Align row appears, with buttons to line them up by left, centre, right, top, middle or bottom. Select three or more and a Spread row is added, to space them evenly across or down. To copy a shape together with its connectors, press Ctrl and D, which drops a duplicate just below and to the right.
Styling a shape
Select a shape and the properties panel fills with its settings. Change one and every shape you have selected changes with it.
- Fill is a row of colour swatches, with a custom colour picker on the end for anything not offered.
- Line sets the outline colour from its own row of swatches.
- Border is Thin, Normal or Bold, with a Dashed switch beside it.
- Text is a size, small, medium or large, with a Bold switch.
- Text colour is another row of swatches.
- A rounded box gains a Corners choice, from slight to very round. A lifeline gains controls for its activation bars, the shaded stretches that show when a participant is busy.
Styling a connector
Click a line instead of a shape and the panel switches to connector settings. Route chooses how the line travels: Elbow turns in right angles, Straight goes corner to corner, and Curve bends smoothly.
End arrow and Start arrow each offer None, a solid Arrow, or a Hollow head, so you can point a line one way, both ways, or neither. A Dashed switch, a Width of Thin, Normal or Bold, and a Line colour finish the look.
There is also a Label box. Type into it to write a word on the line, such as yes, no, or a protocol name. A Delete connector button removes the line and leaves both shapes in place.
Templates to start from
The Templates button opens a grid of ready-made starts. There are eleven: Blank, Flowchart, Org chart, System sketch, Network, UML class, ER sketch, Cloud architecture, Gantt sketch, Sequence, and Swimlanes.
Each one drops a small, correct example onto the canvas for you to edit. They are the quickest way to begin, and a good way to see how a kind of diagram is usually laid out before you build your own from scratch.
Moving around the canvas
The toolbar carries the zoom controls: a minus and a plus, with a percentage between them that you can click to jump back to 100 per cent. Zoom runs from a quarter size up to three times. Fit grows or shrinks the view so the whole diagram sits inside the window.
You can also hold Ctrl and scroll to zoom in on the exact spot under the pointer. To slide the canvas around without selecting anything, hold the space bar and drag, or drag with the middle mouse button.
Saving, opening and exporting
Your work saves itself. As you edit, the diagram is kept in your browser, and the status bar along the bottom shows the word saved once it has. Close the tab and open it again, and the diagram is waiting for you. That store lives on this device only.
To keep a copy you can move or back up, press Save project. It downloads a file named diagram.orchid-diagram, which the Open button reads back later, even on another computer. New clears the canvas for a fresh start.
The Export button offers three files. PNG sharp is a picture at twice the size, best for high-resolution screens. PNG actual size is a picture at normal size. SVG is a vector file, which stays crisp at any size and can be reopened in a drawing program.
Handy keyboard shortcuts
The Shortcuts button lists them all, and the question mark key opens the same list. These are the ones worth learning early.
- Ctrl and Z undoes a step; Ctrl and Y redoes it.
- Ctrl with C, X and V copy, cut and paste. Ctrl and D duplicates, and Ctrl and A selects everything.
- Delete removes the selection. The arrow keys nudge it two pixels at a time, or ten with Shift held down.
- Double-click or F2 edits text. Shift and click adds a shape to the selection. Dragging on empty canvas draws a box that selects several at once.
- Esc clears the selection and closes any open dialog.
A worked example
Open Templates and choose Flowchart. A small chart appears: Start, Do the work, a Did it work? diamond, Done, and a Fix it box that loops back. That is your skeleton.
Double-click 'Do the work' and rename it to your real step. Drag a Process box from the library for a new stage, rest the mouse on the diamond, and pull a dot onto the new box to connect them. Select the new line and type a word into its Label box.
Tidy the chart by dragging boxes until the orange guides line them up. When it looks right, open Export and pick SVG for a report, or PNG to paste into a chat. Your work was already saved to the browser as you went, but press Save project too if you want a file of your own to keep.
When a simpler tool will do
This editor rewards the extra control, but that control is not always worth the effort. For a quick flowchart you would rather type than draw, the text-based Diagram and Flowchart tool on this site writes itself from a few lines and lays itself out for you.
And for a branching outline of ideas, with one centre and topics spreading outward, a mind map tool is the more natural shape. Reach for this studio when you genuinely need free placement and many kinds of shape.
Nothing leaves your device
Org charts and system diagrams are private by nature, so it matters that this one keeps them on your machine. The editor, the autosave, and the exports all run inside your browser. The diagram never touches a server.
You can prove it to yourself. Switch off your internet and keep working, and nothing breaks. The saved copy sits in this browser's own storage, so for anything important, use Save project and keep the file somewhere you trust.